|
And in between Falls the Shadow Using the binomial distribution to predict confidence intervals |
Practical relevance of found values and confidence intervals Effect sizes in the Placidus houses |
Do astrologers according to the AstroDienst database (ADB) differ from the rest of the ADB population? Here are the facts based on the adb_export_181128_2309 file of Nov. 28, 2018. There were 1867 entries in the ADB category Vocation / Occult fields / Astrologer. How were they defined? You can find the used documents in the directory astrologer of adbstats.
Many more gigabytes of statistical ADB data can be found at astrology-research.nl, a website hosted in a mini PC in my fuse box. But few astrologers seems to be interested in statistics. So the website did not run out of resources. Evident lies and subsequent quarrels on Twitter and other social media do adsorb much more bandwidth. But nobody seems to be interested in studying the facts.
But let u now present the in the AstroDienst database found facts.
|
Event: |
False |
Adb Version: |
adb_export_181128_2309 |
||||||||||
|
Human: |
True |
House System: |
Placidus |
||||||||||
|
Male: |
True |
Rodden Rating: |
AA+A+B |
||||||||||
|
Female: |
True |
Category: |
Vocation/Occult_Fields/Astrologer |
||||||||||
|
North Hemisphere: |
True |
|
|
|
|
|
|
|
|
|
|
|
|
|
South Hemisphere: |
True |
|
|
|
|
|
|
|
|
|
|
|
|
|
|
|
|
|
|
|
|
|
|
|
|
|
|
|
|
|
Aries |
Tau |
Gemini |
Cancer |
Leo |
Virgo |
Libra |
Scorp |
Sag |
Cap |
Aqua |
Pisces |
Total |
|
Sun |
177 |
147 |
155 |
158 |
156 |
141 |
145 |
146 |
152 |
159 |
184 |
147 |
1867 |
|
Moon |
161 |
145 |
161 |
166 |
138 |
143 |
151 |
141 |
166 |
165 |
172 |
158 |
1867 |
|
Mercury |
137 |
139 |
146 |
129 |
138 |
146 |
163 |
169 |
168 |
190 |
164 |
178 |
1867 |
|
Venus |
164 |
160 |
144 |
182 |
108 |
182 |
118 |
172 |
146 |
145 |
187 |
159 |
1867 |
|
Mars |
137 |
145 |
173 |
172 |
184 |
177 |
169 |
160 |
163 |
130 |
117 |
140 |
1867 |
|
Jupiter |
122 |
155 |
136 |
140 |
161 |
158 |
172 |
179 |
170 |
151 |
176 |
147 |
1867 |
|
Saturn |
135 |
136 |
136 |
148 |
173 |
174 |
175 |
184 |
176 |
154 |
154 |
122 |
1867 |
|
Uranus |
145 |
172 |
267 |
230 |
148 |
118 |
102 |
129 |
131 |
120 |
142 |
163 |
1867 |
|
Neptune |
50 |
119 |
232 |
238 |
265 |
280 |
440 |
178 |
23 |
6 |
6 |
30 |
1867 |
|
Pluto |
19 |
144 |
488 |
472 |
548 |
158 |
14 |
3 |
1 |
4 |
5 |
11 |
1867 |
|
N Node |
181 |
167 |
177 |
164 |
142 |
153 |
145 |
141 |
144 |
153 |
140 |
160 |
1867 |
|
Chiron |
231 |
196 |
131 |
107 |
101 |
81 |
97 |
114 |
146 |
182 |
210 |
271 |
1867 |
|
|
|
|
|
|
|
|
|
|
|
|
|
|
|
|
|
Aries |
Tau |
Gemini |
Cancer |
Leo |
Virgo |
Libra |
Scorp |
Sag |
Cap |
Aqua |
Pisces |
Total |
|
Cusp 1 |
96 |
95 |
147 |
198 |
209 |
181 |
194 |
197 |
208 |
131 |
117 |
94 |
1867 |
|
Cusp 2 |
109 |
136 |
143 |
189 |
181 |
194 |
162 |
181 |
178 |
163 |
122 |
109 |
1867 |
|
Cusp 3 |
124 |
148 |
164 |
181 |
171 |
165 |
162 |
154 |
172 |
160 |
140 |
126 |
1867 |
|
Cusp 4 |
145 |
163 |
177 |
162 |
159 |
152 |
141 |
161 |
151 |
165 |
155 |
136 |
1867 |
|
Cusp 5 |
160 |
179 |
176 |
171 |
125 |
135 |
130 |
134 |
175 |
154 |
166 |
162 |
1867 |
|
Cusp 6 |
189 |
192 |
176 |
156 |
138 |
96 |
112 |
118 |
162 |
187 |
169 |
172 |
1867 |
|
Cusp 7 |
194 |
197 |
208 |
131 |
117 |
94 |
96 |
95 |
147 |
198 |
209 |
181 |
1867 |
|
Cusp 8 |
162 |
181 |
178 |
163 |
122 |
109 |
109 |
136 |
143 |
189 |
181 |
194 |
1867 |
|
Cusp 9 |
162 |
154 |
172 |
160 |
140 |
126 |
124 |
148 |
164 |
181 |
171 |
165 |
1867 |
|
Cusp 10 |
141 |
161 |
151 |
165 |
155 |
136 |
145 |
163 |
177 |
162 |
159 |
152 |
1867 |
|
Cusp 11 |
130 |
134 |
175 |
154 |
166 |
162 |
160 |
179 |
176 |
171 |
125 |
135 |
1867 |
|
Cusp 12 |
112 |
118 |
162 |
187 |
169 |
172 |
189 |
192 |
176 |
156 |
138 |
96 |
1867 |
|
|
|
|
|
|
|
|
|
|
|
|
|
|
|
|
|
H1 |
H2 |
H3 |
H4 |
H5 |
H6 |
H7 |
H8 |
H9 |
H10 |
H11 |
H12 |
Total |
|
Sun |
169 |
156 |
161 |
144 |
126 |
119 |
116 |
146 |
148 |
183 |
190 |
209 |
1867 |
|
Moon |
144 |
163 |
169 |
174 |
128 |
143 |
154 |
144 |
160 |
160 |
162 |
166 |
1867 |
|
Mercury |
195 |
166 |
167 |
143 |
123 |
108 |
115 |
142 |
176 |
166 |
184 |
182 |
1867 |
|
Venus |
183 |
182 |
164 |
130 |
116 |
120 |
154 |
116 |
166 |
169 |
197 |
170 |
1867 |
|
Mars |
153 |
168 |
143 |
154 |
144 |
139 |
147 |
158 |
155 |
156 |
174 |
176 |
1867 |
|
Jupiter |
159 |
150 |
156 |
161 |
150 |
161 |
147 |
149 |
147 |
168 |
159 |
160 |
1867 |
|
Saturn |
154 |
142 |
161 |
147 |
131 |
169 |
148 |
154 |
167 |
161 |
164 |
169 |
1867 |
|
Uranus |
167 |
147 |
146 |
144 |
150 |
132 |
166 |
155 |
149 |
185 |
183 |
143 |
1867 |
|
Neptune |
126 |
145 |
150 |
151 |
156 |
133 |
182 |
145 |
186 |
188 |
138 |
167 |
1867 |
|
Pluto |
123 |
121 |
136 |
130 |
128 |
127 |
180 |
188 |
202 |
175 |
168 |
189 |
1867 |
|
N Node |
172 |
143 |
168 |
151 |
143 |
159 |
156 |
138 |
157 |
140 |
165 |
175 |
1867 |
|
Chiron |
162 |
176 |
148 |
170 |
140 |
152 |
146 |
146 |
143 |
170 |
147 |
167 |
1867 |
The found values constitute a lot of data, so let us focus on what most astrologers would think that are the most important factors in the chart: Sun and Moon sign and ascendant.
|
|
Aries |
Tau |
Gemini |
Cancer |
Leo |
Virgo |
Libra |
Scorp |
Sag |
Cap |
Aqua |
Pisces |
Total |
|
Sun |
177 |
147 |
155 |
158 |
156 |
141 |
145 |
146 |
152 |
159 |
184 |
147 |
1867 |
|
Moon |
161 |
145 |
161 |
166 |
138 |
143 |
151 |
141 |
166 |
165 |
172 |
158 |
1867 |
|
Cusp 1 |
96 |
95 |
147 |
198 |
209 |
181 |
194 |
197 |
208 |
131 |
117 |
94 |
1867 |
When assuming a risk of one in twelve, 1867/12 is 155,6 would be the expected value. Sun in Leo (156) scores as expected, having an effect size of 1,00.
|
|
Aries |
Tau |
Gemini |
Cancer |
Leo |
Virgo |
Libra |
Scorp |
Sag |
Cap |
Aqua |
Pisces |
Total |
|
Sun |
1,14 |
0,94 |
1,00 |
1,02 |
1,00 |
0,91 |
0,93 |
0,94 |
0,98 |
1,02 |
1,18 |
0,94 |
12,00 |
|
Moon |
1,03 |
0,93 |
1,03 |
1,07 |
0,89 |
0,92 |
0,97 |
0,91 |
1,07 |
1,06 |
1,11 |
1,02 |
12,00 |
|
Cusp 1 |
0,62 |
0,61 |
0,94 |
1,27 |
1,34 |
1,16 |
1,25 |
1,27 |
1,34 |
0,84 |
0,75 |
0,60 |
12,00 |
Sun signs range from 141 for Sun in Virgo (effect size 0,91) to 184 (effect size 1,18) for Sun in Aquarius.
Moon signs differ less having a range of 141 for Moon in Scorpio (effect size 0,91) to 172 for Moon in Aquarius (effect size 1,11) again.
The Ascendants of astrologers differ most from 94 in the fast rising sign Pisces (effect size 0,60) to 209 found in the slow rising sign Leo (effect size 1,34). But to compare the houses, effect size measurements using control groups should be done, as the to be expected scores in fast and slow rising signs differ more than a factor two.
When using the whole ADB as a control group, not that impressive effects were found for the ascendant. Most effect sizes just fall within the 70 % found values range of a random ADB sample of that size (0,92 - 1,08 or just + / - 8 % away from the expected mean). Statisticians would thus not be impressed.
|
|
Aries |
Tau |
Gemini |
Cancer |
Leo |
Virgo |
Libra |
Scorp |
Sag |
Cap |
Aqua |
Pisces |
Total |
|
Sun |
1,10 |
0,91 |
0,96 |
0,99 |
0,97 |
0,92 |
0,95 |
1,01 |
1,07 |
1,05 |
1,18 |
0,90 |
12 |
|
Moon |
1,02 |
0,95 |
1,02 |
1,09 |
0,88 |
0,94 |
0,98 |
0,91 |
1,07 |
1,05 |
1,09 |
1,00 |
12 |
|
Cusp 1 |
1,11 |
0,88 |
0,99 |
1,05 |
1,02 |
0,90 |
0,95 |
0,99 |
1,12 |
0,91 |
1,07 |
1,08 |
12 |
The effect sizes of Sun and Moon signs did not change that much. So, the Aquarians are still the winners of this who is who in astrology contest and the earthly Taureans and Virgo's are scoring lower. The Airy Sagittarians score the best at the Ascendant, but not that impressive.
You may interpret the effect size of 1,12 that getting an Aquarius Ascendant is 12 % more likely under astrologers in this version of the ADB. And the Taurus ascendant (effect size 0,88) is 12 % less seen with astrologers in the ADB. But the standard deviations suggest that we deal with a normally distributed pattern around a certain mean.
According to statisticians we should ignore the found differences as statistically seen irrelevant. As deviations around the expected mean up to +/- 15 % could be expected in 95 % of random samples of this size (n=1867) taken from the ADB. So statistically seen nothing special happened here.
What would be seen if we combined the effect sizes? If the risks involved with Sun, Moon and Ascendant in sign were independent, we could multiply them to get the combined risk or effect size. Below we calculated the risk of becoming an astrologer when having sun, moon and ascendant in the same sign.
|
|
Aries |
Tau |
Gemini |
Cancer |
Leo |
Virgo |
Libra |
Scorp |
Sag |
Cap |
Aqua |
Pisces |
Total |
|
Sun |
1,10 |
0,91 |
0,96 |
0,99 |
0,97 |
0,92 |
0,95 |
1,01 |
1,07 |
1,05 |
1,18 |
0,90 |
12 |
|
Moon |
1,02 |
0,95 |
1,02 |
1,09 |
0,88 |
0,94 |
0,98 |
0,91 |
1,07 |
1,05 |
1,09 |
1,00 |
12 |
|
Cusp 1 |
1,11 |
0,88 |
0,99 |
1,05 |
1,02 |
0,90 |
0,95 |
0,99 |
1,12 |
0,91 |
1,07 |
1,08 |
12 |
|
Product |
1,24 |
0,75 |
0,97 |
1,14 |
0,87 |
0,77 |
0,88 |
0,92 |
1,28 |
1,01 |
1,37 |
0,98 |
12,18 |
The product scores are more interesting. The Earth signs Taurus (0,75 and Virgo (0,77) score again low, except for Capricorn (1,01). Water signs score somehow higher in Cancer (1,14), but not in Scorpio (0,92) or Pisces (0,98). Fire signs Sagittarius (1,28) and Aries (1,24) score higher than expected, but Leo (0,87) does not.
So people having a combined Sun, Moon and Ascendant in Sagittarius or in Aquarius are more likely to become an astrologer, whilst Earthly people having these planets in Taurus and Virgo are less likely to do so. But the effect sizes are still too small to predict or explain an individual astrologer with it. You could only speak of weak tendencies.
 But
are the found differences at least statistically significant? Does
this combined picture of three planets in sign represents real and
lasting tendencies? Probably not. As our sample size (n=1867) is too
small to deal with 12^3 = 1728 possible outcomes. You cannot predict
the behaviour of a 1728 sided dice after only 1867 throws.
But
are the found differences at least statistically significant? Does
this combined picture of three planets in sign represents real and
lasting tendencies? Probably not. As our sample size (n=1867) is too
small to deal with 12^3 = 1728 possible outcomes. You cannot predict
the behaviour of a 1728 sided dice after only 1867 throws.
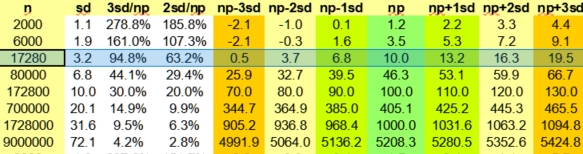
And even when our ADB sample contained 17280 astrologers , you could expect large margins of error (> 60 % in 95% of the cases). And the found values of circa 28 % more or less (with n=1867) are then statically seen irrelevant. I explained this in my course for Dutch reading astrologers in Samenvatting en conclusie:
So the found differences of the combined effects are statistically seen not at all significant, how appealing they may seem to be to most astrologers.
Suppose we were only interested in the astrological properties of the greatest astrologers as they appeared to us, because the small effect sizes found with the 1867 ADB astrologers disappointed us a bit. Indeed, our just found selection of 1867 ADB astrologers resembles astrologically seen just another random ADB sample, with most values fluctuating some 10-15 % around the expected mean. Strong effect sizes of 2 or more were not found. Maybe you expected larger effects with Sagittarius, impressive Sun-Jupiter or Sun-Uranus connections or other suggestions as found in astrology books, but they were not found.
Would studying the top ten of greatest astrologers give you a better impression? In the usual astrological way of thinking it does. As chance does not exists for individuals, the sampling error does not matter. So studying in the astrological way with eye for detail the charts of the ten greatest astrologer would be of great help. As our small sample would not suffer from the by astrologers dreaded regression toward the mean. They just do their best to overcome it.
 If
we would start our study with William
Lilly, we might assume that great astrologers tend to have
Sun in Taurus, Moon in Virgo and a Pisces Ascendant. As that was the
first impression we had. But the next great astrologer we would
study, would have a different astrological signature. We would see
many differences as well as some similarities. And after adding the
tenth great astrologer we would most likely have sun and moon in sign
scores between zero and two, yielding large effect sizes, as getting
a second Sun in Taurus (np = (10-1)/12 expected) already would have
an effect size of 2,4. Wow! Indeed chance does not exist!
If
we would start our study with William
Lilly, we might assume that great astrologers tend to have
Sun in Taurus, Moon in Virgo and a Pisces Ascendant. As that was the
first impression we had. But the next great astrologer we would
study, would have a different astrological signature. We would see
many differences as well as some similarities. And after adding the
tenth great astrologer we would most likely have sun and moon in sign
scores between zero and two, yielding large effect sizes, as getting
a second Sun in Taurus (np = (10-1)/12 expected) already would have
an effect size of 2,4. Wow! Indeed chance does not exist!
Of course you could not get the whole picture with this small sample size, as you would logically seen at least miss two (12-10=2) of them. You would miss practically (statically) seen four of them (Expect 4,19), when you only studied ten astrologers. So four of the twelve possible signs would not pop up in your personal to ten sample. But the results could nevertheless impress you. You might even perceive it as a qualitatively seen a better kind of research than that of the 1867 astrologers as explained above, as you only selected and studied your personal top ten of best astrologers. And you got pretty large effect sizes as a bonus for your wise decision to leave out the many mediocre astrologers of our ADB sample of 1867 astrologers.
You might have some problems with Vedic astrologers and other fields of astrology. As they would present you another top 10 of greatest astrologers. And researchers might complain that the “From him” birth time of William Lilly does not have the more reliable AA status. So it should not be your wise cornerstone to built your small scale research on. But if you ignored those critics, you could still be convinced that you had relevant personal experience with the subject. And indeed you had. But relevant is not the same as statistically significant or scientifically seen reliable. It is just your personal experience with it.
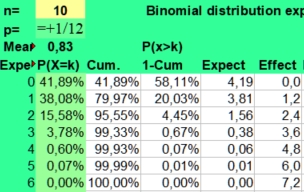
According to statisticians, the found results of any query would not differ that much from throwing 10 times a 12 sided dice. Values of 2 and larger (Px>1) were expected 20,03 % of cases with this sample size. Values of 3 or more (Px>2) would have a likelihood of less than 5 % (4,45 %) in a one-sided statistical test. Only values of 4 and more (Px>3) would be significant in a two-sided test with a p-value of 0,67 %. So, only effect sizes of 4*12/10 = 4,8 and higher would be called statistical significant by statisticians.
And at the lower range of expected values the value of 0 against 10/12 expected would not have any predictive value, as that value would be expected in at least four cases (41,89 %), when throwing 10 times a 12 sided dice. Could you predict another sample of top 10 astrologers with it? Probably not.
But you could share your by chance found findings on an astrology forum and could get many likes from an astrology minded audience. When? Why? Because you argued in their way, unaware of sampling issues. But of course you should not come with data that refuted their expectations. Then they would ignore you. An example of this can be found here: Venus Aspects: Statistical proof of astrological effect.
But in our study of 1867 astrologers we did not get an impressive picture, as most values fluctuated some 10 % around the expected mean of 1/12, having no predictive value at the individual level. The final result does not even resemble William Lilly's astro-signature, as his Sun in Taurus has a risk of 94 %, his Moon in Virgo a risk of 92 % and his fast rising Pisces Ascendant had a seemingly low risk of 60 % of becoming an astrologer. So if we had to ask what are the odds of William Lilly becoming an astrologer, bookmakers basing their decisions on large numbers would not bet on Lilly.
So, the astrological problem found here is that astrologers have to deal with ADB statistics that do not fit their theories. And if they correct for this by only selecting the top ten best astrologers, statisticians would tell them, that they could as well throw dices. Do we deal with lies, damned lies, and statistics? And who is the liar?
And in between Falls the Shadow, wrote the poet T.S. Eliot in the Hollow Men:
Without doubt statistical techniques have become troublesome for astrologers. Just like the fact checking of journalists can be annoying for politicians. Should astrologers get rid of the ADB? Should they provide alternative facts? Of course not. Astrologers initiated, maintained and are still the major contributors of Lois Rodden's groundbreaking project. But contributions from other parties (like svi) were also welcome. As all facts do matter.
Are then the statistical techniques used by scientists the problem? Of course not. Statistical techniques have always been used and propagated by predictive astrologers. Statisticians do not lie, they just present empirical facts where others can base their decisions on. The problem lies more in the different interpretations that scientists and astrologers give to statistical phenomena like the sampling error.
A sitting president like Donald Trump could argue: “The economy flourishes. My merit!” Did under Donald Trump the US economy flourish? Yes, at least for a while. Did he cause it? For his small part, but at the expense of other things like the sustainability of our environment. So a cost-benefit calculation should also be done. As it is not simply a matter of one particular claim against so many other factors.
An astrologer could say: “You had an accident. No wonder, when looking at your Mars transit!” Was Mars responsible for your accident? That seems unlikely. The transit was just an unrelated coincidence a scientist would soundly argue. Did you study it genuinely as proposed in The relative risk of having an accident during a Mars conjunct Ascendant transit? Or did you just rely on the anecdotal evidence of your astrology teachers? Just like religious people might say that God or the Devil did it, because those kinds of things also happened to occur in their sacred books. For them it would thus not be a coincidence, but an act of providence.
All those statements claim causative relations or at least meaningful coincidences. They can simply be postulated, but the predictive or explicative value of the claims involved are often impossible to prove. What about the many other factors that the proponents did not take into account? What makes the difference between a random coincidence and a meaningful coincidence? What effect size a Mars transit should have on the risk of an accident to be predictive? How could you ever determine the validity of their remarks?
Why would astrologers expect a meaningful coincidence? Because accident proneness was supposed to increase during a Mars transit according their astrology books. That could be a valid reason why astrologers would see this particular case not as random coincidence, but as case of synchronicity. The accident was expected. But then questions about the effect sizes and risks involved have to be taken into account. As even a hypothetical risk of a factor 2 or 4 more accidents during a Mars transit would not be that predictive if the normal risk of getting an accident is say one accident per hundred days. Most people (96-98 %) would then have that transit without getting into trouble. It could be a good reason to postpone a dangerous job or a tour with sixty innocent children in your touringcar. But the relative risks and their confidence intervals you need to base your decisions on (“informed guess”) are not mentioned in your astrology books. And if you could not decisively predict that event beforehand, your explanation afterwards will also have a very limited value. Actually, it would just be biased speculation, that was framed as an educated guess.
But if this text about How to Predict Accidents & Injuries were true, then even the position of the injury could be predicted!
So up to four outer planets should have a harsh aspect with a planet, house cusp or ruler symbolising that body part. If we use an orb of 1 degree for all four aspects, up to 2 (degrees)*4 (transiting outer planets )*6 (harsh aspects) *3 (sensitive points) / 360 = 144/360 is 40% of the chart would be at risk. If that part of the circle contained the planet, house cusp or house ruler associated with the body part, you would be in trouble. In practice that area would be smaller because of overlap, so that some small area's could have a bunch of harsh aspects and most areas of your natal chart would be spared. But astrologers could play a little with the orbs or houses systems to make the above prediction come true. And with the normally used wide orbs you could explain any accident using this method. But what would be the p-value of that prediction?
The typical defence of astrologers when being confronted with discrepancies like above, is that they deal with qualities of a higher order than could be grasped by statistically oriented people. And of course most astrologers like this kind of framing of the world of astrology. But is this a good reason to keep believing in the we know it better and ever rules of astrology? How would you explain your astrological rules to your students? Or to your children? How would you define them? What should they have to learn?
See: Qualitative versus quantitative approaches in astrology
An expected mean is just an expected mean, but quite often in astrology as well in other branches of irrational thinking that expected mean is a by tradition coloured opinion. But if you wanted to predict with it statements like Aries people tend to be more aggressive, you should find your suppositions back in the Aggressive ADB category. Empirically inclined ADB editors added typical cases to show you the way.
What we encountered with our top ten of greatest astrologers was the sampling error, which always happens when you only study a part of the population instead of the whole population. But most astrologers and other believers in supernatural things have difficulties with statistical rules. They believe that chance does not exist when they encounter things that fit their expectations. They imagine that they then see things more clearly that others.
But their initial thrill when only having studied some small samples, or doing “my own low-key empirical research” as Sue Tompkins named it in Aspects in astrology, is likely to disappear when they would study larger samples. Because then they would see the by statisticians expected regression towards the mean. Only with the moral help of a lot of other astrologers (Yes Sue, you can do it!), probably also doing some poorly designed small scale research, Sue Tompkins could finish her book.
But what is the value of an astrology book where all possible aspects almost by magic do fit astrological symbolism, but no account of the research methods, found effect sizes and their confidence intervals is given ? Where is the actual research? Did Sue Tomkins report on found facts or only on her expectations? I am afraid she studied foremost the last. As it is rather difficult if not impossible to empirically study the effect of one aspect in the light of the whole chart. To do so, the complexity of the whole chart should be analysed in terms of known probabilities. But astrology books do not provide that kind of information. Astrologers only give vague symbolic clues. But with this associative garbage in, garbage out technique, astrologers can only repeat their belief in established aphorisms, which they joyfully present to you (I saw it again!) as groundbreaking qualitative research. But only from their small and biased point of view.
In what most people regard as reality there are two major exceptions, where we would not expect to see a regression to the population mean with larger sample sizes. First, when there would be some real categorical astrological correlation, like having Sun in Aquarius seemingly predisposing to astrology. Aquarius deals with groups, so current astrologers might be more inclined to group thinking, though they classically see themselves as independent philosophers. And to find out if there has been a shift in time from one dominating sun type, subgroups of the 1867 astrologers could be studied. But when using smaller study groups the sampling error will increase dramatically.
The second instance in which we do not expect a regression to the mean with a larger sample size is some form of bias. The negative effect size of having a Pisces ascendant (0,60) is an obvious example of a systemic bias, because when we corrected for the fast rising signs in the Northern hemisphere its effect size turned into 1,08, having a small positive effect of + 8 %. It is still rather small, so it could be the result of the sampling error. Another form of bias which is more difficult to correct for is the uneven distribution of slow planets in the signs in the ADB.
But how large must a found effect size be, so that it could NOT that easy be explained away by statisticians as just being a result of the sampling error? That depends on the amount of cases in that study. It is thus equivalent to what ordinary people call being experienced. The more cases that were studied, the better would be the research. Here quantity of research definitely coincidences with quality of research.
But the difference with what astrologers conceive as being experienced, is that all the cases and controls must be studied in the same way, preferably as part of one objective study. Only then one can provide exact comparative numbers: We studied 1867 ADB astrologers and compared them to the ADB as a whole. We found the following differences: .... This kind of quantitative research differs qualitatively enormously from the in my opinion talk of astrologers, where exact information about what was exactly done and encountered is not provided. Here reliance is solely given to the expert opinion of the so-called experienced astrologer, who also studied “uncountable” charts without using proper control groups.
An experienced astrologer could indeed have studied thousands of charts over the years, but it is unlikely that he or she did this in a systemic and objective way. Most of the poorly documented impressions of experienced astrologers could thus be based on shared prejudices, selective attention, sampling errors and other well known fallacies of thought and perception. This is the reason why most scientists consider astrology to be a pseudoscience.
For the top 10 astrologers only effect sizes of 3,6 and larger would be statistically seen significant, but with larger sample sizes more precise estimations could be done. As the sampling error depends on the sample size (n) and the risks (p) involved with the event. The larger the sample size n, the smaller the sampling error will be. For this reason academic researchers prefer to study large samples resulting in better predictions of mean value. But the smaller the risk p involved with the event, the harder it will be to get enough cases (np being the expected value) to do your statistical calculations with. This makes unbiased astrology research dealing with unlikely events like specific transits and aspects hard to achieve.
And you certainly would get a lot of problems when you had to interpret their effects in the light of the complexity of the whole chart and its manifold interactions. You might want to focus on one particular transit, but concurrent transits, progressions and so many other not astrologically determined factors could spoil your first impression. For this the reason scientists prefer to use very large case and control groups when they study the effects of some single factor, as with large samples those other disturbing factors tend to level out in case and control groups, because of the law of the large numbers.
But when interpreting one natal chart, there is no control group. The astrological evaluation will fully depend on your correct evaluation of what are the essential astrological events and circumstances at stake and your prior knowledge of similar situations. A medical doctor can rely on plenty of scientific information and scientifically tested investigation methods to discern what is normal or abnormal in his patient. Based on the correct diagnosis he can propose several treatments for the disease that could favourably change the prognosis for the patient. But trustworthy evidence-based background information is lacking in astrology. So the astrologers statement that the coincidence of transit A with event B was a meaningful coincidence is just a subjective speculation, as long as other factors relating to event B were not considered and no serious studies were found that confirmed that relationship before. When you said the transit did it, as this was suggested by some astrology books you read, no judge would be impressed. As astrology books typically are funny mixtures of astrological fact, believes and fiction, that do no adhere to most scientific methods.
Lack of trustworthy background information also plays a role when astrologers try to discover (actually speculate on) the effects of a newly found asteroid on natives in small scale “qualitative” I know it studies, but at the same time also have to take into account the influence of many more supposed to be effective other astrological factors like planets in sign and house and their aspects, without having any empirical knowledge or even clue of their probably very wide confidence intervals. This bad habit results in pseudo-deductive methods like Armchair theorizing:
The on mathematical logic and the empirical found sampling error based statistical testing methods tried to put an end to these popular, just on individual bias based speculating malpractice's.
But doing multivariate analysis on all the possible factors in the individual chart, is impossible with so many uncertain factors even when doing very large scale research. But astrology book writers typically solved that empirical problem by simply applying the once established traditional rules of astrological symbolism to the newly discovered planets signs and houses. As this seemed right according to their believed in astrological constitution. And this on bias and prejudice based constitution became their natural rule of law.
And if some astrological factors were found to statistically significant as in the study of the Gauquelins, the found effect sizes were too small to predict anything with it. So you cannot base your well-framed astrological (or political) stories on it.
 Scientists
would evaluate this not evidence-based habit as foggy prejudice or
bias, but astrologers and politicians would say that this kind of
associative thinking always worked for them.
Scientists
would evaluate this not evidence-based habit as foggy prejudice or
bias, but astrologers and politicians would say that this kind of
associative thinking always worked for them.
They argued: If we cannot objectively measure their effects in the light of the whole chart and so many other unknown not astrologically determined factors, we could at least speculate on them again applying our initial believed in basic assumptions.
And this malpractice indeed makes astrology (and the usual political strategies) clearly a special art of self-deception.
The used method is discussed on the Wikipedia page: Circular reasoning:
But the major empirical problem with astrological symbolism is that none of its premises have ever been found to be true in any serious statistical tests. So you can believe in the heroic tales of them who died for the ideals of Great Britain in a Great War, but many soldiers could tell you another story. If we once listened to them.
 The
risks involved with dices of all kinds, including a dice with 12
faces as used in astrology, have been calculated by Renaissance
astrologers and mathematicians. The mathematics is rather simple, as
we deal with a hit or a miss. But it becomes more complex, when we
throw more dices. The risk of a hit is p and that of a miss is 1-p.
When doubling p is 1/2, when throwing dices it is 1/6 and in
astrology probabilities around 1/12 are usually encountered.
The
risks involved with dices of all kinds, including a dice with 12
faces as used in astrology, have been calculated by Renaissance
astrologers and mathematicians. The mathematics is rather simple, as
we deal with a hit or a miss. But it becomes more complex, when we
throw more dices. The risk of a hit is p and that of a miss is 1-p.
When doubling p is 1/2, when throwing dices it is 1/6 and in
astrology probabilities around 1/12 are usually encountered.
See: Geronimo Cardano and the Book on Games of Chance which is an article in which we explain how we used the normal and binomial distributions to evaluate found frequencies.
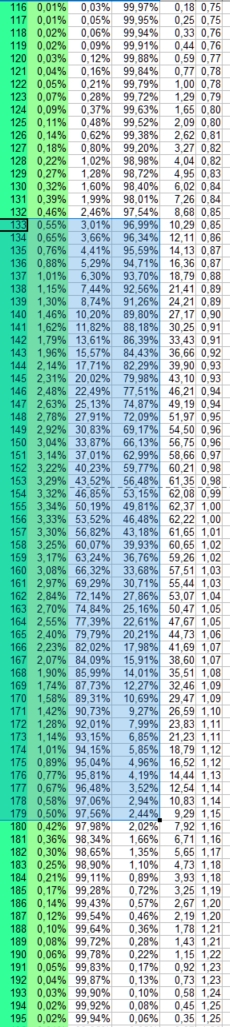
According to the binomial distribution (expected p = 1/12, n=1867) on the right, values from 133 to 179 could be expected in 95 % of cases when just taking a random sample of the ADB with 1876 members. They were selected in the picture on the right.
Only values of 132 or lower (CumPx =132 is 2,46 %, effect size is 132*12/1867 = 0,85) and 180 or higher (Px>178 is 2,44 %, effect size is 180*12/1867 = 1,16) would have a large enough deviation from the mean, to be considered statistically significant in one counting the found sample experiment using an alpha of 5%.
 The
statistical concepts involved with it are really simple. If
astrologers really would have twice as often Sun in 9 (we actually
found an effect size of 1,05, thus only 5 % more often), we would not
deal with the variation around the expected sample mean of 1867/12 =
155,6 (np) of random ADB charts, but with a variation around
np is 1867/6 is 311,2 which would be typical for the subcategory
astrologers.
The
statistical concepts involved with it are really simple. If
astrologers really would have twice as often Sun in 9 (we actually
found an effect size of 1,05, thus only 5 % more often), we would not
deal with the variation around the expected sample mean of 1867/12 =
155,6 (np) of random ADB charts, but with a variation around
np is 1867/6 is 311,2 which would be typical for the subcategory
astrologers.
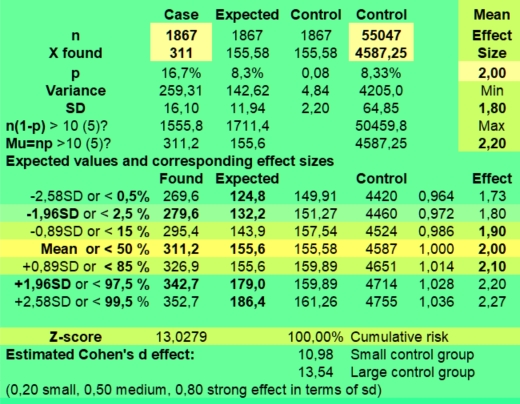
And then we would have a really convincing case for astrology. As we would not see the expected values between 133 to 179 in 95 % of cases dealing with p = 1 /12, but actual found values ranging from 300 to 343 dealing with p = 1/6 having a strong effect size of 2 with a clear 1,80 - 2,20 confidence interval.
When measured values do differ that clearly from the expected values, the so-called Null hypothesis stating that the differences between found and expected values were just the result of chance had to be firmly rejected.
See the values in the green calculator on the left where the normal approximation of the binomial distribution is used. The Z score of expressing differences between found and expected values in terms of standard deviations from the mean would be 13, predicting with almost 100,0 % certainty that we deal with different population means and not just the kind of false impressions based on the standard error one would get when doing small scale research.
You can see the values in the picture on the left showing under Expected values and corresponding effect sizes. With an effect size of 2 the values predicting with 95 % certainty the expected (mean 155,6, range 132,2 - 179,0) and found means (311 found, range 300 - 343) do not overlap. Nor did their 99 % confidence intervals overlap (186 < 270). And the last is very important, because we did not test or scan for a single astrological hypothesis like Do astrologers have more often have a Sagittarian sun?, but tested many astrological assumptions at the same time.
Actually, most astrologers also exhibit datamining when they scan individual charts for special features like aspects, predominant signs or houses. They do their “discoveries” without control groups, but rely on rather vague ideas of how a normal chart should look like. So when studying the earlier mentioned top 10 astrologers, they would not only look for Sun, Moon and Ascendant in a systematic way, but would selectively pick out anything special more often.
What we did and most astrologers habitually do when scanning a chart for prominent features is datamining, doing many measurements at the same time. But when using this technique some 5 % (or 1 in 20) false positive higher or lower than expected values would be found just by chance, when using the 95 % confidence interval (having an alpha of 0,05). When looking for exceptions to the rule in the three tables presented above of 12 planets in 12 signs, 12 house cusps in 12 signs, 12 planets in 12 houses, 3 times 144 is 432 values were measured, having an expected false positive rate of 432/20 is 21,6 (95% ci 13-31) using the 95 % confidence interval (type I error).
Those false positives could initiate a lot of unneeded speculation on astrology boards. For this reason the more strict one against hundred random samples criterion would be more reasonable. When using the 99 % confidence interval, we would on average have 4,32 (1-9) false positives in the first three tables needing some special exploration. Of course, when we dealt with real and strong effect sizes like factor 2 or more in our sample of astrologers, we would not have to deal so much with those kind of questions. We would only have to deal with questions about the impact of the found effect size. But when dealing with a small effect size of 1,2 instead of 2.0, the question arises: is their is any likely positive effect size at all?
Some astrologers might criticise our approach as not being exact, but it is still more conclusive than the results of the usual low-key empirical research implicitly done by astrology book writers. They can only speak of might and could be effects, without mentioning any confidence interval of their expectations. So they are always right, but without predicting anything at all.
From the found values we could estimate effect sizes, by dividing the found values by the in the ADB expected population means. But effect sizes also have a confidence interval.
If you throw a dice once and you got the value of six, would that imply that the value six had a risk of six times more often found than expected? Yes, as that was the only found value in your at first glance experiment, but more tests should be done to give the other five sides of the dice a chance to pop up. As they had a natural chance of n-p = 1-1/6 = 5/6 (83,3%) to be missed.
 In
our ADB studies expected values and effect sizes were calculated
using the whole ADB as a control group. For Sun and Moon the
expected mean values based on 1/12 risks could be used, but for many
other measured values, the found values in the ADB served as a better
control group. See: Using
a control group to evaluate frequencies.
In
our ADB studies expected values and effect sizes were calculated
using the whole ADB as a control group. For Sun and Moon the
expected mean values based on 1/12 risks could be used, but for many
other measured values, the found values in the ADB served as a better
control group. See: Using
a control group to evaluate frequencies.
But it they are not available one could assume a 1/12 probability to get an impression of the range of expected values. This is done in the long table of the binomial distribution on the left above. What could we according to the polymath Cardano expect?
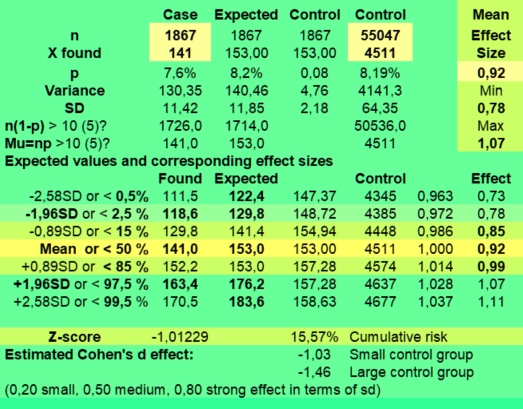
According to the binomial distribution above, the lowest Sun in sign value of 141 for Sun in Virgo could be found in 1,62 % of cases when just taking a random sample of the ADB. But getting a value of 141 or lower with p is 1/12, would just by chance have a risk of 11,82 %. Statisticians would not be impressed by it. More studies with other cases should be done.
When using the Sun in virgo values of the ADB control group in the green calculator (picture on the right under Expected), we see a 95 % confidence interval of 130 (129,8) up to 176 (176,2) corresponding to effect sizes of 0,78 - 1,07.
The found value of 141 (effect size 0,92) would thus not be statistical significant. The risk of getting getting a value of 141 or lower had a cumulative risk of 15,57 % assuming a normally distributed distribution. As the found value deviated only 1 standard deviation from the expected mean (Z-score of -1,01).
 The
highest found value for Sun in Aquarius (184) falls outside
the range of in 95 % of cases expected values when taking a random
sample from the ADB. As P(X >183) is 1,35 % and thus smaller than
2,5 %. We found 184 (9,9 %) of them against 1867/12 = 155,6 (8,33 %)
predicted, having an effect size of 1,18.
The
highest found value for Sun in Aquarius (184) falls outside
the range of in 95 % of cases expected values when taking a random
sample from the ADB. As P(X >183) is 1,35 % and thus smaller than
2,5 %. We found 184 (9,9 %) of them against 1867/12 = 155,6 (8,33 %)
predicted, having an effect size of 1,18.
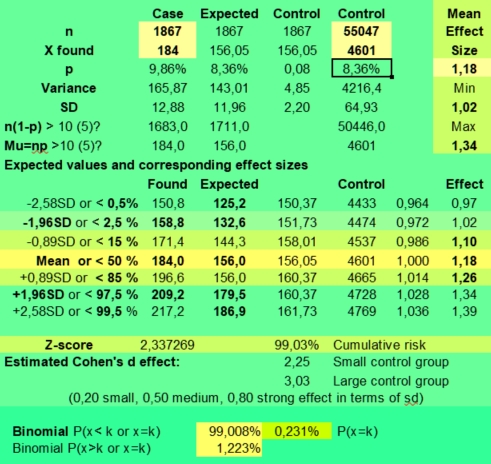
Because our sample was retrieved from the ADB, using the in the ADB found frequency of Sun in Aquarius being 4601/55047 or 8,36 % would be more appropriate.
This yields the same effect size 1,18 (95 % range 1,02 - 1,34), which is statistically significant at the 95 % level (having a range of 133- 180), but not yet at the 99 % level (having a range of 125 - 187).
See the values under Expected in the picture on the left.
The Z score of 2,3 and Cohen's d effect value of 3,03 indicate that there is little overlap between the estimated population means of the case and control group, as they differ more than two standard deviations (Z score of 2,3).
The binomial risk of getting P(x >182) is 1,22% .
When it comes to practical relevance, the small effect size of 1,18 and its confidence interval (95 % range 1,02 - 1,34) must be leading. As the mean of a group is just the mean of a group, but not all members of a group behave like their mean. Within groups found variation (intra-group variation) is as important as between groups (inter-group) found variance. This has been discussed in Predicting at the individual level in 79 art critics.
Suppose that we would not have found that small, but significant group difference of 18 %, but a huge effect size of having 100 % more risk of becoming an astrologer as a Sagittarian. What then? Few Sagittarians would choose for that exceptional profession and only one sixth of the astrologers would be a Sagittarian. So, could you predict with it? Maybe, but not that well. And would thus a reading afterwards like: John is an astrologer. John has Sun in Aquarius. Sun in Aquarius is found twice as often with astrologers. No wonder that John became an astrologer! have any explanatory value? No.
For astrologers, who are not accustomed to use control groups, this argument seems to work. So it could be seen as valid argument on astrology forums. But statisticians would say: If you only knew that John had Sun in Aquarius, having a two times more often risk of becoming an astrologer and you also could know that some 3 % of the ADB population were astrologers, what would be the risk according to the ADB of John becoming an astrologer? Only six percent. So, this is not a good explanatory reason to assume that John became an astrologer.
But in practice the risk of becoming an astrologer is much lower, because astrologers are obviously over-represented in the ADB. And the major problem is that we only found an effect size of 1,18. In this case when you only knew that John had Sun in Aquarius, having 18 % more risk of becoming an astrologer and you also knew that some 3 % of the ADB population were astrologers, the ADB risk of John becoming an astrologer would be 3,54 % instead of 3 % .
In that case you had to look to other chart factors, as the combination of many fitting astrological indicators could increase the risk. But to do so, you have to know the risks. Astrology books do not provide them. And then you have to make them up. But astrology books provide you a lot of room for story telling. So you can play with it, like Cardano once played with binomial risks and lost a lot of money.
The values for the Moon in sign differ from 141 for Moon in Scorpio (P < 142 = 11,82 %) to 172 for Moon in Aquarius again (P > 171 = 9,27 %). Both values fall outside the 70 % range of most likely values when just taking a random ADB sample (143-168), but are still within the in 95 % to be expected found values of random ADB samples assuming a probability of 1/12. Could you predict with it? Probably not. When we calculated their confidence intervals, they could have a positive and negative effect as well.
The values for the ascendant differ most, but that pattern is strongly influenced by the effect of ascension length at different latitudes. Many statistical significant effect sizes were found for the sign of the ascendant, but using p = 1/12 would be bad idea because of the fast and slow rising signs, so we used the ADB as a control group to calculate the effect sizes. See: The ADB as a control group.
|
|
Aries |
Taurus |
Gemini |
Cancer |
Leo |
Virgo |
Libra |
Scorp |
Sag |
Cap |
Aqua |
Pisces |
|
Cusp 1 |
0,62 |
0,61 |
0,94 |
1,27 |
1,34 |
1,16 |
1,25 |
1,27 |
1,34 |
0,84 |
0,75 |
0,60 |
|
Cusp 1 |
1,11 |
0,88 |
0,99 |
1,05 |
1,02 |
0,90 |
0,95 |
0,99 |
1,12 |
0,91 |
1,07 |
1,08 |
When correcting for this systemic bias, the found effect sizes are not that impressive any more. See the for the houses expected found and expected values below.
The expected effect size range was 0,85 - 1,15 or + / - 15 % for the 95 % confidence interval. It is 0,80 - 1,20 or + / - 20 % when using an alpha of 0,01. But all Ascendant values were within the in 95 % of cases predicted values around the expected mean. Could you predict with it? Probably not.
What were the found and expected values in the Placidus houses? The expected standard deviation can be calculated as the square root of variance np(1-p), which is 11,95 with n is 1867 and p = 1/12. This would result in an expected effect size range of 0,85 - 1,15 or + / - 15 % using the 95 % confidence interval of a normal distribution. It is 0,80 - 1,20 or + / - 20 % when using an alpha of 0,01. The actual found standard deviation of the effect sizes of planet in house are placed at the end of the rows. The are given as a percentage.
In this case the effect sizes in the Placidus houses were calculated based on the expected values of the ADB control group they were part of.
Do we see effect sizes for planets in house that lie outside the expected values? Thus effect size values larger than +/- 15 % or more appropriate +/- 20 % because we are doing data mining in a table with 144 values. Only two values met the 99 % confidence interval criterion: Neptune in 10 (1,21) and Mercury in 6 (0,79). But they could be expected in a table of 144 items.
|
|
H1 |
H2 |
H3 |
H4 |
H5 |
H6 |
H7 |
H8 |
H9 |
H10 |
H11 |
H12 |
SD % |
|
Sun |
0,95 |
0,92 |
1,02 |
0,99 |
0,92 |
0,89 |
0,84 |
1,04 |
1,04 |
1,06 |
1,09 |
1,17 |
9,31% |
|
Moon |
0,93 |
1,05 |
1,08 |
1,12 |
0,83 |
0,93 |
0,97 |
0,94 |
1,03 |
1,03 |
1,03 |
1,05 |
8,08% |
|
Mercury |
1,11 |
0,97 |
1,02 |
0,96 |
0,88 |
0,79 |
0,84 |
1,05 |
1,17 |
1,03 |
1,08 |
1,03 |
11,12% |
|
Venus |
1,05 |
1,09 |
1,04 |
0,90 |
0,81 |
0,88 |
1,11 |
0,82 |
1,10 |
1,03 |
1,14 |
0,96 |
11,64% |
|
Mars |
0,95 |
1,06 |
0,93 |
1,04 |
0,96 |
0,97 |
0,97 |
1,02 |
1,00 |
0,95 |
1,07 |
1,05 |
4,78% |
|
Jupiter |
1,04 |
0,96 |
0,99 |
1,04 |
0,95 |
1,03 |
0,96 |
0,98 |
0,96 |
1,05 |
1,05 |
1,01 |
3,92% |
|
Saturn |
0,97 |
0,90 |
1,05 |
0,93 |
0,84 |
1,08 |
0,94 |
1,02 |
1,12 |
1,06 |
1,05 |
1,07 |
8,52% |
|
Uranus |
1,08 |
0,98 |
0,97 |
0,95 |
0,97 |
0,87 |
1,05 |
0,99 |
0,92 |
1,17 |
1,13 |
0,92 |
8,89% |
|
Neptune |
0,82 |
0,95 |
0,99 |
0,99 |
1,00 |
0,87 |
1,17 |
0,90 |
1,14 |
1,21 |
0,88 |
1,07 |
12,66% |
|
Pluto |
0,94 |
0,95 |
1,00 |
0,97 |
0,98 |
0,97 |
1,02 |
1,06 |
1,12 |
0,98 |
0,91 |
1,05 |
5,80% |
|
N Node |
1,12 |
0,93 |
1,10 |
0,98 |
0,89 |
1,02 |
1,02 |
0,90 |
0,99 |
0,90 |
1,05 |
1,11 |
8,35% |
|
Chiron |
1,05 |
1,14 |
0,98 |
1,10 |
0,89 |
0,98 |
0,93 |
0,95 |
0,91 |
1,07 |
0,95 |
1,06 |
8,18% |
The highest score is for Neptune in 10 (1,21). Neptune in 7, Uranus in 10, Mercury in 9 and Sun in 12 all score 1,17. The lowest score is for Mercury in 6 (0,79). Then come Venus in 5 (0,81), Neptune in 1 and Venus in 8 with 0,82 and Sun in 7 and Mercury in 7 with 0,84. But they all have their confidence intervals.
Twelve values fall outside the the 95 % confidence range against 144/20 is 7,2 false positives expected (type 1 error). When using the more reasonable 99 % confidence interval, some 1 % or 144/100 or on average 1,4 false positives could be expected. So the effect size values for Neptune in 10 (1,21) and Mercury in 6 (0,79) are likely due to chance. They certainly do not present outliers.
When calculating Cohen's d values, we see other values. Here effect size is expressed as the found difference (observed values minus expected values) divided by the some averaged standard deviation of the two groups. See: Cohen's D value. They tell us how the two found values in case and control groups (our best estimate of their means) differ in terms of found variation in the two groups. Because this sounds rather abstract, let us provide you an example that is more easy to comprehend.
With a small Cohen's d value the estimates of the group means overlap and this will result in an minimal effect size with a large confidence interval having no statistical significance at all. Even insurance companies would pay little attention to them.
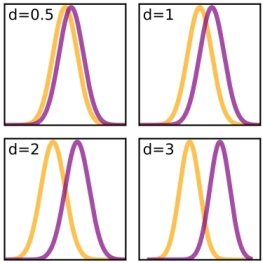 With
larger Cohen's d values the risk that the groups on average
differ increases. With huge Cohen's d values, the differences between
found values (expected mean values) is that large (2 averaged
standard deviations), that the difference between the expected group
means is likely to be statistical significant. But could you predict
with it?
With
larger Cohen's d values the risk that the groups on average
differ increases. With huge Cohen's d values, the differences between
found values (expected mean values) is that large (2 averaged
standard deviations), that the difference between the expected group
means is likely to be statistical significant. But could you predict
with it?
The Cohen's d value takes into account both the expected (found) variance as the actual found effect size. So it gives us probably the best hint to the right direction.
|
Effect size |
Cohen's d |
Reference |
|---|---|---|
|
Very small |
0,01 |
Sawilowsky, 2009 |
|
Small |
0,20 |
Cohen, 1988 |
|
Medium |
0,50 |
Cohen, 1988 |
|
Large |
0,80 |
Cohen, 1988 |
|
Very large |
1,20 |
Sawilowsky, 2009 |
|
Huge |
2,00 |
Sawilowsky, 2009 |
But when it comes to predicting effect sizes and their confidence intervals do matter, as small effects sizes can be very statistical significant, but not be that predictive in practice at all. But large effect size's found when doing “my own low-key empirical research” as Sue Tomkins named it in Aspects in astrology, are likely to disappear when you study larger samples.
Under the header Mars and other effects in 79 art critics, we showed that planets in house are not that evenly distributed as most astrologers might assume. Maybe for that reason Mercury in 6 (effect size 0,79), having a Cohen's d of -1,23 scores not that impressive as Saturn in 5 (effect size 0,84), having a Cohen's d of -2,97.
Chiron in 2 (2,40), Uranus in 10 (2,21), Neptune in 10 (2,18), North Node in 1 (2,03), Moon in 4 (2,01) and Saturn in 9 (2,00) have the largest Cohen's d value.
Moon (-2,78) and Saturn (-2,96) in 5 scored lowest, pointing to strong negative correlations that did not fit the astrologers profile.
|
|
H1 |
H2 |
H3 |
H4 |
H5 |
H6 |
H7 |
H8 |
H9 |
H10 |
H11 |
H12 |
SD |
|
Sun |
-0,34 |
-0,53 |
0,15 |
-0,06 |
-0,43 |
-0,64 |
-0,94 |
0,23 |
0,24 |
0,46 |
0,63 |
1,25 |
0,62 |
|
Moon |
-1,05 |
0,89 |
1,26 |
2,01 |
-2,78 |
-1,20 |
-0,48 |
-0,88 |
0,53 |
0,49 |
0,46 |
0,76 |
1,31 |
|
Mercury |
0,82 |
-0,24 |
0,17 |
-0,22 |
-0,69 |
-1,23 |
-0,96 |
0,28 |
1,08 |
0,20 |
0,56 |
0,23 |
0,70 |
|
Venus |
0,41 |
0,68 |
0,27 |
-0,66 |
-1,20 |
-0,74 |
0,69 |
-1,09 |
0,65 |
0,23 |
1,07 |
-0,31 |
0,77 |
|
Mars |
-0,76 |
0,95 |
-1,06 |
0,64 |
-0,53 |
-0,46 |
-0,41 |
0,31 |
0,06 |
-0,78 |
1,13 |
0,91 |
0,77 |
|
Jupiter |
1,04 |
-1,35 |
-0,38 |
1,05 |
-1,57 |
1,03 |
-1,08 |
-0,67 |
-1,34 |
1,46 |
1,36 |
0,45 |
1,18 |
|
Saturn |
-0,61 |
-1,81 |
0,86 |
-1,35 |
-2,96 |
1,41 |
-1,05 |
0,29 |
2,00 |
1,04 |
0,91 |
1,27 |
1,53 |
|
Uranus |
0,98 |
-0,25 |
-0,37 |
-0,66 |
-0,39 |
-1,65 |
0,65 |
-0,18 |
-1,10 |
2,21 |
1,76 |
-1,01 |
1,17 |
|
Neptune |
-1,85 |
-0,55 |
-0,09 |
-0,07 |
0,04 |
-1,30 |
1,79 |
-1,09 |
1,57 |
2,18 |
-1,31 |
0,69 |
1,32 |
|
Pluto |
-0,30 |
-0,23 |
0,02 |
-0,14 |
-0,10 |
-0,15 |
0,11 |
0,38 |
0,76 |
-0,14 |
-0,56 |
0,34 |
0,35 |
|
N Node |
2,03 |
-1,14 |
1,65 |
-0,31 |
-1,85 |
0,31 |
0,26 |
-1,72 |
-0,18 |
-1,75 |
0,88 |
1,81 |
1,41 |
|
Chiron |
0,89 |
2,40 |
-0,38 |
1,68 |
-1,99 |
-0,31 |
-1,20 |
-0,88 |
-1,64 |
1,29 |
-0,92 |
1,07 |
1,42 |
Another way to look at the values, is to compare the variance of the absolute found values in rows. This is done using the Chi Square test. In this case the distribution of house positions of Neptune is very significant: 0,4 % expected in random ADB samples. As you can see above, Neptune in 7, 9 and 10 house scores high and Neptune in 1, 6, 8 and 11 scores low. So having the great deceiver in the houses of relations, belief and work seems to predispose for becoming an astrologer. Believe it or not.
|
|
H1 |
H2 |
H3 |
H4 |
H5 |
H6 |
H7 |
H8 |
H9 |
H10 |
H11 |
H12 |
ChiSq |
P % |
|
Sun |
0,37 |
0,96 |
0,08 |
0,01 |
0,78 |
1,75 |
3,67 |
0,22 |
0,22 |
0,7 |
1,27 |
4,95 |
14,99 |
18,3 |
|
Moon |
0,65 |
0,46 |
0,92 |
2,36 |
4,54 |
0,85 |
0,13 |
0,46 |
0,16 |
0,14 |
0,12 |
0,33 |
11,13 |
43,2 |
|
Mercury |
2,07 |
0,18 |
0,09 |
0,18 |
1,85 |
6,01 |
3,67 |
0,32 |
4,19 |
0,13 |
1,02 |
0,16 |
19,89 |
4,7 |
|
Venus |
0,49 |
1,43 |
0,23 |
1,54 |
5,14 |
2,07 |
1,76 |
4,31 |
1,41 |
0,17 |
3,38 |
0,27 |
22,21 |
2,3 |
|
Mars |
0,35 |
0,55 |
0,71 |
0,27 |
0,18 |
0,14 |
0,11 |
0,06 |
0 |
0,36 |
0,76 |
0,48 |
3,97 |
97,1 |
|
Jupiter |
0,19 |
0,31 |
0,02 |
0,19 |
0,42 |
0,18 |
0,2 |
0,08 |
0,31 |
0,35 |
0,32 |
0,03 |
2,63 |
99,5 |
|
Saturn |
0,17 |
1,57 |
0,37 |
0,87 |
4,2 |
0,96 |
0,53 |
0,04 |
2,01 |
0,54 |
0,4 |
0,77 |
12,42 |
33,3 |
|
Uranus |
0,88 |
0,06 |
0,13 |
0,41 |
0,14 |
2,55 |
0,39 |
0,03 |
1,06 |
4,37 |
2,73 |
0,93 |
13,67 |
25,2 |
|
Neptune |
4,97 |
0,44 |
0,01 |
0,01 |
0 |
2,49 |
4,61 |
1,65 |
3,37 |
6,84 |
2,45 |
0,68 |
27,52 |
0,4 |
|
Pluto |
0,52 |
0,32 |
0 |
0,12 |
0,05 |
0,13 |
0,05 |
0,63 |
2,52 |
0,08 |
1,35 |
0,51 |
6,29 |
85,3 |
|
N Node |
2,28 |
0,71 |
1,51 |
0,05 |
1,8 |
0,05 |
0,04 |
1,63 |
0,02 |
1,66 |
0,41 |
1,75 |
11,93 |
36.9 |
|
Chiron |
0,41 |
3,02 |
0,08 |
1,48 |
2,03 |
0,05 |
0,75 |
0,41 |
1,38 |
0,86 |
0,44 |
0,58 |
11,49 |
40,3 |
The other house positions that seem to matter are that of Venus (2,3 %) and Mercury (4,7 %). But the house position of Mars (97,1 %), Jupiter (99,5 % ) and to a lesser extent Pluto (85,3 %) do not differ from random ADB samples.
Aspects between planets are considered to be very important by astrologers. They have thus been measured and compared to the aspects found in the ADB. Of course the same orbs were used. But if you look at all aspects of 1867 ADB astrologers, and thus are dealing with the law of the large numbers, the found effect sizes are not that impressive.
|
All Aspects |
|
|
|
|
|
|
|
|
|
|
|
|
Sun |
|
|
|
|
|
|
|
|
|
|
|
|
1,04 |
Moon |
|
|
|
|
|
|
|
|
|
|
|
1,07 |
1,00 |
Mercury |
|
|
|
|
|
|
|
|
|
|
1,00 |
0,98 |
0,95 |
Venus |
|
|
|
|
|
|
|
|
|
1,01 |
1,00 |
0,98 |
0,96 |
Mars |
|
|
|
|
|
|
|
|
0,99 |
1,02 |
0,98 |
0,96 |
0,99 |
Jupiter |
|
|
|
|
|
|
|
0,97 |
0,96 |
1,02 |
0,98 |
1,01 |
0,99 |
Saturn |
|
|
|
|
|
|
0,99 |
0,98 |
0,99 |
1,00 |
0,96 |
0,97 |
0,95 |
Uranus |
|
|
|
|
|
1,01 |
0,98 |
0,99 |
1,00 |
1,03 |
0,94 |
1,06 |
0,99 |
Neptune |
|
|
|
|
1,03 |
0,97 |
1,03 |
1,03 |
1,01 |
1,02 |
0,99 |
1,03 |
0,96 |
Pluto |
|
|
|
0,99 |
0,97 |
0,98 |
1,00 |
1,03 |
1,03 |
0,98 |
0,94 |
1,01 |
1,04 |
N Node |
|
|
1,00 |
1,03 |
1,00 |
0,96 |
1,04 |
1,00 |
0,98 |
0,90 |
0,97 |
1,02 |
0,95 |
Chiron |
The highest value for Sun - Mercury aspects (1,07) score only 7 % higher than expected according to the ADB. Jupiter aspects being often associated with astrology, do not impress with effect sizes between 0,96 and 1,03.
The lowest scores are for Mercury-Venus (0,95), Uranus - Chiron (0,90), Uranus - North Node (0,94) and North Node -Chiron (0,95).
Below you see the counts of found aspects divided by the expected aspects based on a large ADB control group. So we speak of effect sizes. More explanation is given under The actual risks involved with aspects in 79 art critics.
The statistical problem with aspects is that they are manifold, but tend to have low probabilities. So their individual effects are in practice impossible to analyse given the many other factors supposed to be active in the whole chart. An astrology researcher could try using multivariate analysis to disentangle all the chart factors like epidemiologists study factors involved with morbidity, but few astrologers would follow him or sell his books. Why? Because the results would disappoint them. So, most astrologers prefer to speculate using astrological symbolism, which is the by their branch accepted malpractice astrologers can adhere to, when they do not know anything at all about the subject. And they imagine themselves that their holistic intuition will tell them the truth. Astrological symbolism could be a universal language that somehow might be magically true, but is impossible to check in the empirical way. And as long as the typically vague astrological speculations cannot be proven to be wrong, they are still seen as valid by the astrological community. It could be called their alternative Null hypothesis. Of course no astrologer could ever empirically proof the astrological claim that Neptune deals with illusion, but astrologers still believe in it.
But what did we see in the table above? Effect sizes deviating only some 5 percent around some expected mean do not have any predictive value for statisticians. But if you still believed in astrological symbolism you would not look at the numbers but to the quality assigned to them. But then you dealt with another kind of statistics, having more or less risk involved with it. But how would you define that risks?
The highest effect size was found for Neptune conjunct Pluto (1,97). With 154 cases found against 78,1 expected, this is a statistical significant effect having a confidence interval of 1,67 - 2,27. Uranus conjunct Neptune scored lowest with 0,11 (0 - 0,23). Here 4 cases were found against 34,90 expected, which is a remarkable difference. The conjunction existed from 1821-3 and more recently from end 1988 to 1998.
|
Conjunction: Orb Factor: +- 6 |
|
|
|
|
|
|
|
|
|
|
|
|
Sun |
|
|
|
|
|
|
|
|
|
|
|
|
0,88 |
Moon |
|
|
|
|
|
|
|
|
|
|
|
1,07 |
0,86 |
Mercury |
|
|
|
|
|
|
|
|
|
|
1,00 |
1,05 |
0,98 |
Venus |
|
|
|
|
|
|
|
|
|
0,90 |
1,10 |
0,92 |
0,89 |
Mars |
|
|
|
|
|
|
|
|
0,91 |
1,03 |
1,08 |
0,98 |
0,91 |
Jupiter |
|
|
|
|
|
|
|
1,05 |
1,01 |
1,11 |
1,02 |
1,01 |
0,84 |
Saturn |
|
|
|
|
|
|
0,78 |
0,97 |
1,13 |
1,02 |
1,11 |
1,23 |
0,88 |
Uranus |
|
|
|
|
|
1,05 |
0,89 |
1,06 |
0,83 |
1,23 |
0,75 |
1,06 |
0,11 |
Neptune |
|
|
|
|
0,93 |
1,06 |
1,02 |
1,00 |
1,02 |
0,96 |
1,16 |
0,56 |
1,97 |
Pluto |
|
|
|
1,08 |
1,00 |
1,24 |
1,08 |
0,96 |
0,92 |
1,04 |
0,99 |
0,95 |
0,96 |
N Node |
|
|
0,96 |
1,07 |
0,87 |
0,99 |
1,12 |
1,18 |
0,74 |
1,45 |
1,05 |
0,99 |
0,81 |
Chiron |
|
|
|
|
|
|
|
|
|
|
|
|
|
|
Semi-Sextile: Orb Factor: +- 2 |
|
|
|
|
|
|
|
|
|
|
|
|
Sun |
|
|
|
|
|
|
|
|
|
|
|
|
1,38 |
Moon |
|
|
|
|
|
|
|
|
|
|
|
0,00 |
0,95 |
Mercury |
|
|
|
|
|
|
|
|
|
|
1,10 |
1,16 |
0,99 |
Venus |
|
|
|
|
|
|
|
|
|
1,23 |
0,93 |
0,94 |
0,85 |
Mars |
|
|
|
|
|
|
|
|
1,34 |
1,15 |
0,86 |
0,97 |
0,79 |
Jupiter |
|
|
|
|
|
|
|
1,03 |
1,07 |
0,81 |
0,91 |
0,97 |
1,16 |
Saturn |
|
|
|
|
|
|
0,97 |
1,00 |
1,02 |
1,01 |
0,72 |
0,77 |
1,07 |
Uranus |
|
|
|
|
|
1,00 |
0,89 |
0,89 |
1,21 |
1,31 |
0,95 |
1,10 |
0,19 |
Neptune |
|
|
|
|
1,10 |
1,09 |
0,91 |
1,08 |
0,86 |
0,94 |
1,36 |
1,01 |
1,05 |
Pluto |
|
|
|
0,98 |
0,75 |
0,81 |
0,74 |
1,09 |
1,06 |
0,91 |
0,79 |
0,96 |
1,06 |
N Node |
|
|
1,02 |
1,08 |
0,88 |
0,91 |
0,86 |
1,15 |
1,16 |
1,12 |
1,06 |
1,00 |
0,78 |
Chiron |
|
|
|
|
|
|
|
|
|
|
|
|
|
|
Semi-Square: Orb Factor: +- 2 |
|
|
|
|
|
|
|
|
|
|
|
|
Sun |
|
|
|
|
|
|
|
|
|
|
|
|
1,19 |
Moon |
|
|
|
|
|
|
|
|
|
|
|
0,00 |
1,27 |
Mercury |
|
|
|
|
|
|
|
|
|
|
0,96 |
0,94 |
0,92 |
Venus |
|
|
|
|
|
|
|
|
|
0,91 |
0,95 |
1,10 |
1,09 |
Mars |
|
|
|
|
|
|
|
|
1,08 |
1,11 |
1,07 |
1,04 |
0,87 |
Jupiter |
|
|
|
|
|
|
|
0,94 |
0,82 |
0,92 |
0,96 |
0,98 |
0,97 |
Saturn |
|
|
|
|
|
|
0,76 |
0,81 |
0,84 |
1,00 |
0,78 |
0,89 |
1,20 |
Uranus |
|
|
|
|
|
1,01 |
1,12 |
1,06 |
1,28 |
1,19 |
1,03 |
1,21 |
0,25 |
Neptune |
|
|
|
|
1,13 |
1,13 |
1,07 |
1,01 |
1,43 |
0,86 |
0,69 |
1,14 |
0,91 |
Pluto |
|
|
|
1,12 |
1,09 |
0,88 |
1,26 |
1,14 |
1,03 |
0,77 |
0,99 |
0,65 |
1,12 |
N Node |
|
|
1,03 |
0,88 |
1,16 |
0,98 |
1,19 |
0,89 |
1,42 |
1,07 |
1,24 |
0,84 |
1,05 |
Chiron |
|
|
|
|
|
|
|
|
|
|
|
|
|
|
Sextile: Orb Factor: +- 4 |
|
|
|
|
|
|
|
|
|
|
|
|
Sun |
|
|
|
|
|
|
|
|
|
|
|
|
1,11 |
Moon |
|
|
|
|
|
|
|
|
|
|
|
0,00 |
1,32 |
Mercury |
|
|
|
|
|
|
|
|
|
|
0,00 |
1,11 |
0,86 |
Venus |
|
|
|
|
|
|
|
|
|
0,99 |
1,03 |
1,01 |
1,08 |
Mars |
|
|
|
|
|
|
|
|
1,04 |
1,07 |
0,90 |
0,95 |
0,96 |
Jupiter |
|
|
|
|
|
|
|
0,83 |
1,09 |
1,06 |
1,16 |
0,96 |
0,80 |
Saturn |
|
|
|
|
|
|
0,94 |
1,10 |
0,93 |
0,94 |
1,08 |
0,96 |
1,11 |
Uranus |
|
|
|
|
|
1,08 |
1,13 |
1,11 |
0,89 |
1,10 |
0,77 |
1,23 |
0,65 |
Neptune |
|
|
|
|
0,93 |
0,99 |
0,92 |
0,98 |
0,85 |
1,12 |
0,94 |
0,95 |
0,89 |
Pluto |
|
|
|
1,09 |
1,03 |
0,92 |
1,05 |
1,02 |
1,16 |
0,94 |
0,81 |
1,03 |
1,23 |
N Node |
|
|
1,18 |
1,00 |
0,94 |
0,91 |
0,77 |
0,95 |
0,84 |
1,13 |
1,40 |
0,94 |
0,97 |
Chiron |
|
|
|
|
|
|
|
|
|
|
|
|
|
|
Quintile: Orb Factor: +- 2 |
|
|
|
|
|
|
|
|
|
|
|
|
Sun |
|
|
|
|
|
|
|
|
|
|
|
|
1,09 |
Moon |
|
|
|
|
|
|
|
|
|
|
|
0,00 |
1,06 |
Mercury |
|
|
|
|
|
|
|
|
|
|
0,00 |
1,17 |
1,06 |
Venus |
|
|
|
|
|
|
|
|
|
0,91 |
1,11 |
0,95 |
0,96 |
Mars |
|
|
|
|
|
|
|
|
1,24 |
1,11 |
0,86 |
0,82 |
1,10 |
Jupiter |
|
|
|
|
|
|
|
0,84 |
0,93 |
1,08 |
1,05 |
1,14 |
0,87 |
Saturn |
|
|
|
|
|
|
0,95 |
0,87 |
1,11 |
1,00 |
0,97 |
1,01 |
0,71 |
Uranus |
|
|
|
|
|
0,96 |
0,82 |
0,90 |
1,12 |
1,08 |
0,86 |
0,97 |
0,81 |
Neptune |
|
|
|
|
1,00 |
0,72 |
0,97 |
0,87 |
1,19 |
0,85 |
0,91 |
1,09 |
0,32 |
Pluto |
|
|
|
1,10 |
1,04 |
0,76 |
1,20 |
0,74 |
1,20 |
1,04 |
0,92 |
1,35 |
0,98 |
N Node |
|
|
0,81 |
1,10 |
1,26 |
1,06 |
1,20 |
1,12 |
1,07 |
1,15 |
0,73 |
1,15 |
0,98 |
Chiron |
|
|
|
|
|
|
|
|
|
|
|
|
|
|
Square: Orb Factor: +- 6 |
|
|
|
|
|
|
|
|
|
|
|
|
Sun |
|
|
|
|
|
|
|
|
|
|
|
|
1,02 |
Moon |
|
|
|
|
|
|
|
|
|
|
|
0,00 |
1,03 |
Mercury |
|
|
|
|
|
|
|
|
|
|
0,00 |
0,95 |
0,00 |
Venus |
|
|
|
|
|
|
|
|
|
0,98 |
0,96 |
0,91 |
0,93 |
Mars |
|
|
|
|
|
|
|
|
0,96 |
0,99 |
1,05 |
1,00 |
1,07 |
Jupiter |
|
|
|
|
|
|
|
1,03 |
1,10 |
1,07 |
1,07 |
0,98 |
1,01 |
Saturn |
|
|
|
|
|
|
1,12 |
1,12 |
0,86 |
0,90 |
0,97 |
0,80 |
0,96 |
Uranus |
|
|
|
|
|
1,04 |
1,06 |
0,87 |
1,03 |
0,82 |
0,97 |
1,06 |
1,18 |
Neptune |
|
|
|
|
0,95 |
0,97 |
0,92 |
1,26 |
0,94 |
0,95 |
0,91 |
0,86 |
0,28 |
Pluto |
|
|
|
0,89 |
1,09 |
0,90 |
0,97 |
1,05 |
0,95 |
1,08 |
0,98 |
1,10 |
1,03 |
N Node |
|
|
1,04 |
1,02 |
0,99 |
0,94 |
1,10 |
0,90 |
1,22 |
0,81 |
1,11 |
0,99 |
0,97 |
Chiron |
|
|
|
|
|
|
|
|
|
|
|
|
|
|
Trine: Orb Factor: +- 6 |
|
|
|
|
|
|
|
|
|
|
|
|
Sun |
|
|
|
|
|
|
|
|
|
|
|
|
0,97 |
Moon |
|
|
|
|
|
|
|
|
|
|
|
0,00 |
0,93 |
Mercury |
|
|
|
|
|
|
|
|
|
|
0,00 |
0,85 |
0,00 |
Venus |
|
|
|
|
|
|
|
|
|
1,11 |
1,00 |
0,91 |
1,06 |
Mars |
|
|
|
|
|
|
|
|
0,85 |
0,87 |
0,85 |
0,85 |
0,99 |
Jupiter |
|
|
|
|
|
|
|
0,95 |
0,94 |
1,08 |
0,84 |
0,97 |
1,06 |
Saturn |
|
|
|
|
|
|
1,06 |
1,06 |
1,01 |
1,14 |
0,92 |
1,03 |
0,94 |
Uranus |
|
|
|
|
|
0,89 |
1,01 |
1,03 |
0,97 |
0,86 |
1,13 |
0,88 |
1,11 |
Neptune |
|
|
|
|
1,13 |
1,06 |
1,12 |
0,99 |
1,09 |
1,04 |
1,02 |
1,00 |
0,22 |
Pluto |
|
|
|
0,96 |
0,89 |
1,21 |
1,01 |
0,94 |
0,99 |
1,00 |
1,01 |
1,06 |
0,93 |
N Node |
|
|
1,04 |
0,98 |
0,94 |
0,88 |
1,20 |
0,88 |
0,69 |
1,04 |
0,91 |
1,26 |
0,98 |
Chiron |
|
|
|
|
|
|
|
|
|
|
|
|
|
|
Sesquiquadrate: Orb Factor: +- 2 |
|
|
|
|
|
|
|
|
|
|
|
|
Sun |
|
|
|
|
|
|
|
|
|
|
|
|
0,97 |
Moon |
|
|
|
|
|
|
|
|
|
|
|
0,00 |
0,68 |
Mercury |
|
|
|
|
|
|
|
|
|
|
0,00 |
0,91 |
0,00 |
Venus |
|
|
|
|
|
|
|
|
|
0,99 |
0,87 |
0,90 |
0,73 |
Mars |
|
|
|
|
|
|
|
|
0,65 |
0,98 |
0,96 |
1,04 |
1,03 |
Jupiter |
|
|
|
|
|
|
|
1,16 |
0,82 |
1,11 |
0,84 |
1,01 |
0,93 |
Saturn |
|
|
|
|
|
|
0,79 |
0,59 |
0,97 |
1,04 |
0,98 |
0,86 |
0,75 |
Uranus |
|
|
|
|
|
1,15 |
1,00 |
1,11 |
1,02 |
0,86 |
1,05 |
1,10 |
0,97 |
Neptune |
|
|
|
|
0,84 |
1,10 |
1,23 |
1,12 |
1,20 |
1,12 |
1,01 |
1,37 |
0,00 |
Pluto |
|
|
|
0,76 |
0,84 |
1,10 |
1,02 |
0,90 |
1,17 |
0,84 |
0,82 |
0,74 |
1,08 |
N Node |
|
|
0,92 |
0,81 |
1,25 |
1,10 |
0,89 |
0,93 |
0,86 |
0,90 |
0,87 |
1,22 |
1,25 |
Chiron |
|
|
|
|
|
|
|
|
|
|
|
|
|
|
BiQuintile: Orb Factor: +- 2 |
|
|
|
|
|
|
|
|
|
|
|
|
Sun |
|
|
|
|
|
|
|
|
|
|
|
|
1,04 |
Moon |
|
|
|
|
|
|
|
|
|
|
|
0,00 |
1,01 |
Mercury |
|
|
|
|
|
|
|
|
|
|
0,00 |
0,91 |
0,00 |
Venus |
|
|
|
|
|
|
|
|
|
0,87 |
1,08 |
0,96 |
0,83 |
Mars |
|
|
|
|
|
|
|
|
1,35 |
1,18 |
0,99 |
0,87 |
1,12 |
Jupiter |
|
|
|
|
|
|
|
0,93 |
0,79 |
0,95 |
0,96 |
1,27 |
1,21 |
Saturn |
|
|
|
|
|
|
1,24 |
0,77 |
1,12 |
1,09 |
0,81 |
1,10 |
0,96 |
Uranus |
|
|
|
|
|
1,02 |
0,96 |
0,99 |
0,81 |
1,08 |
1,10 |
1,20 |
1,21 |
Neptune |
|
|
|
|
1,13 |
0,84 |
1,12 |
1,01 |
0,79 |
1,03 |
1,02 |
1,48 |
1,97 |
Pluto |
|
|
|
0,81 |
1,03 |
0,98 |
0,79 |
1,01 |
1,13 |
0,83 |
0,93 |
0,81 |
1,13 |
N Node |
|
|
0,97 |
1,25 |
1,18 |
0,69 |
1,11 |
1,19 |
0,81 |
0,75 |
0,77 |
0,85 |
1,00 |
Chiron |
|
|
|
|
|
|
|
|
|
|
|
|
|
|
Quincunx: Orb Factor: +- 2 |
|
|
|
|
|
|
|
|
|
|
|
|
Sun |
|
|
|
|
|
|
|
|
|
|
|
|
0,88 |
Moon |
|
|
|
|
|
|
|
|
|
|
|
0,00 |
0,82 |
Mercury |
|
|
|
|
|
|
|
|
|
|
0,00 |
0,77 |
0,00 |
Venus |
|
|
|
|
|
|
|
|
|
1,14 |
1,10 |
1,39 |
0,93 |
Mars |
|
|
|
|
|
|
|
|
0,91 |
0,82 |
1,25 |
0,95 |
1,00 |
Jupiter |
|
|
|
|
|
|
|
0,73 |
0,90 |
0,90 |
1,00 |
1,06 |
1,30 |
Saturn |
|
|
|
|
|
|
0,91 |
0,99 |
1,25 |
0,89 |
1,08 |
0,96 |
0,87 |
Uranus |
|
|
|
|
|
1,22 |
0,63 |
1,05 |
0,91 |
1,13 |
0,93 |
1,09 |
1,36 |
Neptune |
|
|
|
|
1,12 |
0,80 |
1,20 |
0,80 |
0,75 |
0,97 |
1,16 |
1,45 |
0,00 |
Pluto |
|
|
|
1,03 |
0,99 |
0,78 |
0,82 |
1,10 |
1,17 |
0,86 |
0,70 |
1,17 |
0,91 |
N Node |
|
|
0,85 |
1,27 |
0,92 |
1,40 |
0,75 |
0,92 |
0,64 |
1,27 |
0,82 |
0,86 |
0,90 |
Chiron |
|
|
|
|
|
|
|
|
|
|
|
|
|
|
Opposite: Orb Factor: +- 6 |
|
|
|
|
|
|
|
|
|
|
|
|
Sun |
|
|
|
|
|
|
|
|
|
|
|
|
1,03 |
Moon |
|
|
|
|
|
|
|
|
|
|
|
0,00 |
0,95 |
Mercury |
|
|
|
|
|
|
|
|
|
|
0,00 |
1,04 |
0,00 |
Venus |
|
|
|
|
|
|
|
|
|
1,25 |
0,88 |
1,23 |
0,96 |
Mars |
|
|
|
|
|
|
|
|
0,87 |
1,13 |
0,99 |
1,13 |
0,97 |
Jupiter |
|
|
|
|
|
|
|
1,06 |
0,80 |
0,84 |
0,93 |
0,94 |
0,93 |
Saturn |
|
|
|
|
|
|
1,09 |
1,02 |
0,94 |
0,98 |
1,01 |
0,96 |
0,84 |
Uranus |
|
|
|
|
|
0,83 |
0,98 |
0,85 |
1,07 |
1,21 |
0,77 |
0,99 |
1,26 |
Neptune |
|
|
|
|
1,18 |
0,82 |
1,01 |
0,98 |
1,04 |
1,26 |
0,80 |
1,65 |
1,18 |
Pluto |
|
|
|
1,09 |
0,85 |
0,99 |
1,05 |
1,36 |
0,87 |
1,18 |
1,18 |
1,03 |
0,99 |
N Node |
|
|
0,92 |
1,04 |
0,92 |
0,95 |
0,97 |
1,01 |
0,61 |
0,65 |
0,76 |
0,92 |
0,76 |
Chiron |
The scores of 1,20 and higher were: Mercury conjunct North Node (1,24), Jupiter conjunct Uranus (1,23), Mars conjunct Neptune (1,23), Neptune conjunct Pluto (1,97), Uranus conjunct Chiron (1,45), Sun semi-sextile Moon (1,38), Sun semi-sextile Mars (1,23), Sun semi-sextile Jupiter (1,34), Venus semi-sextile Neptune (1,21), Mars semi-sextile Neptune (1,31), Saturn semi-sextile Pluto (1,36), Moon semi-square Mercury (1,27), Venus semi-square Neptune (1,28), Venus semi-square North Node (1,26), Saturn semi-square Neptune (1,21), Mars semi-square Pluto (1,43), Saturn semi-square Uranus (1,20), Saturn semi-square Chiron (1,42), Neptune semi-square Chiron (1,24), Moon sextile Mercury (1,32), Saturn sextile Neptune (1,23) Neptune sextile Chiron (1,40), Pluto sextile North Node (1,23), Sun quintile Jupiter (1,24), Mercury quintile Chiron (1,26), Venus quintile North Node (1,20), Mars quintile Chiron (1,20), Jupiter quintile North Node (1,20), Neptune quintile North Node (1,35), Venus square Pluto (1,26), Mars square Chiron (1,20), Saturn square Chiron (1,22), Mercury trine North Node (1,21), Pluto trine Chiron (1,21), Mercury sesquiquadrate Pluto (1,23), Mercury sesquiquadrate Chiron (1,25), Mars sesquiquadrate Pluto (1,20), Uranus sesquiquadrate Pluto (1,37), Pluto sesquiquadrate Chiron (1,25), North Node sesquiquadrate Chiron (1,25), Sun biquintile Jupiter (1,35), Sun biquintile Uranus (1,24), Moon biquintile Chiron (1,25), Mars biquintile Saturn (1,27), Jupiter biquintile Saturn (1,21), Saturn biquintile Neptune (1,20), Uranus biquintile Neptune (1,21), Uranus biquintile Pluto (1,48), Neptune biquintile Pluto (1,97), Sun quincunx Neptune (1,22), Moon quincunx Chiron (1,27), Mercury quincunx Pluto (1,20), Uranus quincunx Pluto (1,45), Mercury quincunx Mars (1,39), Mercury quincunx Jupiter (1,25), Mercury quincunx Uranus (1,25), Jupiter quincunx Saturn (1,30), Venus quincunx Chiron (1,40), Uranus quincunx Neptune (1,36), Uranus quincunx Chiron (1,27), Sun opposite Mars (1,25), Mercury opposite Mars (1,23), Mars opposite Neptune (1,21), Mars opposite North Node (1,36), Jupiter opposite Pluto (1,26), Uranus opposite Neptune (1,26) and Uranus opposite Pluto (1,65).
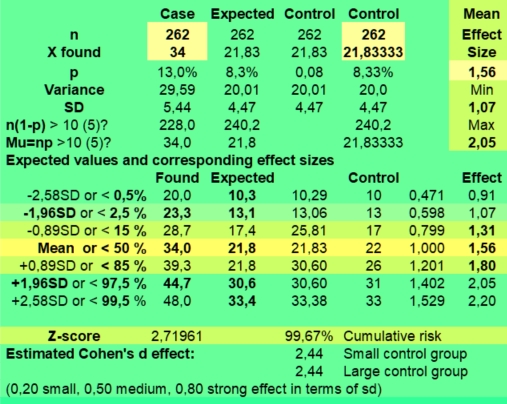 Scores
of 0,80 and lower were: Uranus conjunct Neptune (0,11),
Sun conjunct Uranus (0,78), Jupiter conjunct Neptune (0,75), Saturn
conjunct Chiron (0,74), Uranus conjunct Pluto (0,56), Mars
semi-sextile Jupiter (0,79), Mars semi-sextile Uranus (0,72), Jupiter
semi-sextile Uranus (0,77), Uranus semi-sextile Neptune (0,19), Moon
semi-sextile North Node (0,75), Venus semi-sextile North Node (0,74),
Uranus semi-sextile North Node (0,79), North Node semi-sextile Chiron
(0,78), Sun semi-square Uranus (0,76), Mars semi-square Uranus
(0,78), Saturn semi-square North Node (0,77), Uranus semi-square
Neptune (0,25), Saturn semi-square Pluto (0,69), Neptune semi-square
North Node (0,65), Jupiter square Uranus (0,80), Neptune square
Uranus (0,28), Neptune trine Uranus (0,22), Uranus sextile Neptune
(0,65), Jupiter sextile Saturn (0,80), Jupiter sextile Neptune
(0,77), Mars sextile Chiron (0,77), Saturn quintile Uranus (0,71),
Moon quintile Pluto (0,72), Mercury quintile North Node (0,76), Mars
quintile North Node (0,74), Neptune quintile Pluto (0,32), Neptune
quintile North Node (0,73), Saturn trine Chiron (0,69), Sun
sesquiquadrate North Node (0,76), Moon sesquiquadrate Uranus (0,59),
Moon sesquiquadrate Mercury (0,68), Sun sesquiquadrate Jupiter
(0,65), Sun sesquiquadrate Uranus (0,79), Venus sesquiquadrate Mars
(0,73), Saturn sesquiquadrate Uranus (0,75), Neptune sesquiquadrate
North Node (0,74), Venus biquintile Chiron (0,69), Moon biquintile
Saturn (0,79), Moon biquintile Uranus (0,77), Venus biquintile North
Node (0,79), Mars biquintile Pluto (0,79), Uranus biquintile Chiron
(0,75), Neptune biquintile Chiron (0,77), Sun quincunx Saturn (0,73),
Moon quincunx Pluto (0,80), Venus quincunx Pluto (0,80), Mars
quincunx Chiron (0,75), Saturn quincunx Chiron (0,64), Moon quincunx
Venus (0,77), Mars quincunx Pluto (0,75), Mercury quincunx North Node
(0,78), Uranus quincunx North Node (0,70), Moon opposite Saturn
(0,80), Jupiter opposite Neptune (0,77), Saturn opposite Pluto
(0,80), Neptune opposite Chiron (0,76), North Node opposite Chiron
(0,76) and Saturn opposite Chiron (0,61).
Scores
of 0,80 and lower were: Uranus conjunct Neptune (0,11),
Sun conjunct Uranus (0,78), Jupiter conjunct Neptune (0,75), Saturn
conjunct Chiron (0,74), Uranus conjunct Pluto (0,56), Mars
semi-sextile Jupiter (0,79), Mars semi-sextile Uranus (0,72), Jupiter
semi-sextile Uranus (0,77), Uranus semi-sextile Neptune (0,19), Moon
semi-sextile North Node (0,75), Venus semi-sextile North Node (0,74),
Uranus semi-sextile North Node (0,79), North Node semi-sextile Chiron
(0,78), Sun semi-square Uranus (0,76), Mars semi-square Uranus
(0,78), Saturn semi-square North Node (0,77), Uranus semi-square
Neptune (0,25), Saturn semi-square Pluto (0,69), Neptune semi-square
North Node (0,65), Jupiter square Uranus (0,80), Neptune square
Uranus (0,28), Neptune trine Uranus (0,22), Uranus sextile Neptune
(0,65), Jupiter sextile Saturn (0,80), Jupiter sextile Neptune
(0,77), Mars sextile Chiron (0,77), Saturn quintile Uranus (0,71),
Moon quintile Pluto (0,72), Mercury quintile North Node (0,76), Mars
quintile North Node (0,74), Neptune quintile Pluto (0,32), Neptune
quintile North Node (0,73), Saturn trine Chiron (0,69), Sun
sesquiquadrate North Node (0,76), Moon sesquiquadrate Uranus (0,59),
Moon sesquiquadrate Mercury (0,68), Sun sesquiquadrate Jupiter
(0,65), Sun sesquiquadrate Uranus (0,79), Venus sesquiquadrate Mars
(0,73), Saturn sesquiquadrate Uranus (0,75), Neptune sesquiquadrate
North Node (0,74), Venus biquintile Chiron (0,69), Moon biquintile
Saturn (0,79), Moon biquintile Uranus (0,77), Venus biquintile North
Node (0,79), Mars biquintile Pluto (0,79), Uranus biquintile Chiron
(0,75), Neptune biquintile Chiron (0,77), Sun quincunx Saturn (0,73),
Moon quincunx Pluto (0,80), Venus quincunx Pluto (0,80), Mars
quincunx Chiron (0,75), Saturn quincunx Chiron (0,64), Moon quincunx
Venus (0,77), Mars quincunx Pluto (0,75), Mercury quincunx North Node
(0,78), Uranus quincunx North Node (0,70), Moon opposite Saturn
(0,80), Jupiter opposite Neptune (0,77), Saturn opposite Pluto
(0,80), Neptune opposite Chiron (0,76), North Node opposite Chiron
(0,76) and Saturn opposite Chiron (0,61).
All the twelve planets were involved in the 126 aspects with the strongest effect sizes but with different frequencies : Sun (14), Moon (14), Mercury (15), Venus (12), Mars (22), Jupiter (17), Saturn (23), Uranus (34), Neptune (34), Pluto (25), North Node (24) and Chiron (28). Do we see a pattern in it?
Clearly, relevant aspects having an effect size of +/- 20 % or larger involving slow planets are seen much more often under astrologers as compared to the whole ADB. And in this case we clearly do not deal with expected variations around a mean. Only Mars (51,5 %) and Saturn (60,3 %) come close to the mean of 21,8 at 50 % percentile, but Sun, Moon, Mercury and especially Venus score score lower and the slow planets much larger than expected.
|
|
Found |
% |
Cum |
|
|
|
|
Sun |
14 |
5,3% |
4,0% |
Gemiddelde |
21,83 |
|
|
Moon |
14 |
5,3% |
4,0% |
Standaardfout |
2,2 |
|
|
Mercury |
15 |
5,7% |
6,3% |
Modus |
14 |
|
|
Venus |
12 |
4,6% |
1,4% |
Mediaan |
22,5 |
|
|
Mars |
22 |
8,4% |
51,5% |
Eerste kwartiel |
14,75 |
|
|
Jupiter |
17 |
6,5% |
14,0% |
Derde kwartiel |
25,75 |
|
|
Saturn |
23 |
8,8% |
60,3% |
Variantie |
58,15 |
|
|
Uranus |
34 |
13,0% |
99,7% |
Standaarddeviatie |
7,63 |
|
|
Neptune |
34 |
13,0% |
99,7% |
Kurtosis |
-1 |
|
|
Pluto |
25 |
9,5% |
76,1% |
Scheefheid |
0,38 |
|
|
North Node |
24 |
9,2% |
68,6% |
Bereik |
22 |
|
|
Chiron |
28 |
10,7% |
91,6% |
Minimum |
12 |
|
|
|
|
|
|
Maximum |
34 |
|
|
|
|
|
|
Som |
262 |
|
|
|
|
|
|
Aantal |
12 |
|
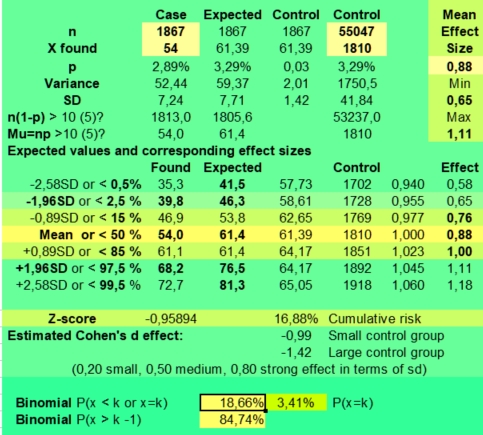 To
test the statistical significance of the effect sizes above, we
developed a tool that calculated the binomial risk of getting that
value based on the expected values in the ADBs. That value is given
in percents. A value below 2,5 would be significant in 95 % of random
ADB samples, a value below 0,5 in 99% of random ADB samples.
To
test the statistical significance of the effect sizes above, we
developed a tool that calculated the binomial risk of getting that
value based on the expected values in the ADBs. That value is given
in percents. A value below 2,5 would be significant in 95 % of random
ADB samples, a value below 0,5 in 99% of random ADB samples.
In this case we calculated the risks of having a Sun-Moon conjunction and being an astrologer in the ADB.
The expected risk of getting a 54 of Sun-Moon conjunctions under 1867 astrologers was calculated as 1810/55047 is 3,29 %. The effect size was 0,88, having an 95% confidence interval of 0,65-1,11 according to the normal distribution. So it would not be that predictive.
The binomial risk involved with getting a 54 or less against 59,37 expected is only 18,66%. So statisticians would not be impressed. You see the value back in the table below with a minus sign, to indicate that is on the left of the binomial distribution and refers to P(x< k or x=k).
Larger than predicted values are positive. They are P(x> k or x=k) or P(x>k-1). Only the lowest value of the pair is displayed. Notice that for found values that are close to expected mean both values could be larger than 0,5. In this case P(x=k) will be large. For effect sizes of zero (0 found), no risks were calculated.
What values would impress statisticians? For certain not the the equal to 2,5 % or lesser values as quite a lot false positives (66/20 is 3,1) could be expected for each aspect table using the 5% not expected criterion. For this reason found values of < 0,50 should be searched for. So instead of being amazed by more or less could be predicted values, you should scan the provided for 0, -values, otherwise you just meet the fallacy of the sampling error.
|
Conjunction: Orb Factor: +- 6 |
|
|
|
|
|
|
|
|
|
|
|
|
||
|
Sun |
|
|
|
|
|
|
|
|
|
|
|
|
|
|
|
-18,66 |
Moon |
|
|
|
|
|
|
|
|
|
|
|
|
|
|
10,21 |
-13,84 |
Mercury |
|
|
|
|
|
|
|
|
|
|
|
|
|
50,10 |
37,79 |
-41,34 |
Venus |
|
|
|
|
|
|
|
|
|
|
|
|
-15,71 |
22,88 |
-21,65 |
-12,42 |
Mars |
|
|
|
|
|
|
|
|
|
|
|
-22,71 |
43,14 |
26,78 |
-44,83 |
-25,29 |
Jupiter |
|
|
|
|
|
|
|
|
|
|
35,39 |
48,09 |
17,96 |
46,35 |
47,28 |
-11,00 |
Saturn |
|
|
|
|
|
|
|
|
|
-3,12 |
-42,98 |
14,80 |
43,83 |
19,85 |
2,28 |
-18,41 |
Uranus |
|
|
|
|
|
|
|
|
35,26 |
-20,10 |
33,62 |
-8,87 |
3,94 |
-2,07 |
33,19 |
0,00 |
Neptune |
|
|
|
|
|
|
|
-31,90 |
31,99 |
43,76 |
-51,80 |
45,31 |
-40,22 |
9,90 |
-0,00 |
0,00 |
Pluto |
|
|
|
|
|
|
27,54 |
50,89 |
3,65 |
25,91 |
-40,03 |
-31,00 |
39,31 |
-51,11 |
-38,87 |
-40,08 |
N Node |
|
|
|
|
|
-40,44 |
31,21 |
-15,44 |
-48,48 |
20,81 |
4,63 |
-7,71 |
3,31 |
34,84 |
-51,43 |
-7,49 |
Chiron |
|
|
|
|
|
|
|
|
|
|
|
|
|
|
|
|
|
|
|
|
Semi-Sextile: Orb Factor: +- 2 |
|
|
|
|
|
|
|
|
|
|
|
|
||
|
Sun |
|
|
|
|
|
|
|
|
|
|
|
|
|
|
|
1,14 |
Moon |
|
|
|
|
|
|
|
|
|
|
|
|
|
|
|
-40,09 |
Mercury |
|
|
|
|
|
|
|
|
|
|
|
|
|
11,61 |
17,21 |
-49,13 |
Venus |
|
|
|
|
|
|
|
|
|
|
|
|
3,60 |
-36,27 |
-33,00 |
-13,26 |
Mars |
|
|
|
|
|
|
|
|
|
|
|
1,33 |
19,24 |
-18,10 |
-44,57 |
-8,09 |
Jupiter |
|
|
|
|
|
|
|
|
|
|
44,87 |
34,57 |
-9,52 |
-29,74 |
-45,43 |
18,16 |
Saturn |
|
|
|
|
|
|
|
|
|
-45,58 |
-52,98 |
48,15 |
48,82 |
-3,57 |
-6,04 |
34,97 |
Uranus |
|
|
|
|
|
|
|
|
-53,04 |
-27,26 |
-24,91 |
10,33 |
3,06 |
-39,32 |
22,34 |
-0,00 |
Neptune |
|
|
|
|
|
|
|
27,07 |
29,25 |
-31,42 |
32,23 |
-19,61 |
-39,87 |
0,81 |
50,08 |
34,58 |
Pluto |
|
|
|
|
|
|
-48,19 |
-6,02 |
-10,75 |
-4,89 |
31,72 |
35,50 |
-32,72 |
-10,72 |
-43,21 |
35,27 |
N Node |
|
|
|
|
|
47,72 |
31,27 |
-23,62 |
-32,13 |
-20,96 |
13,35 |
14,88 |
10,15 |
39,93 |
51,57 |
-11,20 |
Chiron |
|
|
|
|
|
|
|
|
|
|
|
|
|
|
|
|
|
|
|
|
Semi-Square: Orb Factor: +- 2 |
|
|
|
|
|
|
|
|
|
|
|
|
||
|
Sun |
|
|
|
|
|
|
|
|
|
|
|
|
|
|
|
12,00 |
Moon |
|
|
|
|
|
|
|
|
|
|
|
|
|
|
|
4,91 |
Mercury |
|
|
|
|
|
|
|
|
|
|
|
|
|
-20,98 |
-38,06 |
-24,62 |
Venus |
|
|
|
|
|
|
|
|
|
|
|
|
-26,25 |
-41,75 |
22,82 |
25,71 |
Mars |
|
|
|
|
|
|
|
|
|
|
|
31,39 |
24,16 |
33,00 |
42,39 |
-23,51 |
Jupiter |
|
|
|
|
|
|
|
|
|
|
-37,34 |
-12,55 |
-32,04 |
-44,02 |
-48,22 |
-45,22 |
Saturn |
|
|
|
|
|
|
|
|
|
-6,80 |
-12,61 |
-17,05 |
52,01 |
-7,51 |
-26,77 |
9,59 |
Uranus |
|
|
|
|
|
|
|
|
50,56 |
22,70 |
35,54 |
4,01 |
12,32 |
43,06 |
13,22 |
-0,00 |
Neptune |
|
|
|
|
|
|
|
21,72 |
21,74 |
34,62 |
50,67 |
0,35 |
-19,32 |
-2,51 |
17,33 |
-20,70 |
Pluto |
|
|
|
|
|
|
23,17 |
30,13 |
-24,11 |
5,46 |
21,80 |
42,61 |
-6,04 |
-52,62 |
-1,03 |
26,16 |
N Node |
|
|
|
|
|
43,82 |
-24,42 |
15,54 |
-48,49 |
11,87 |
-33,04 |
1,14 |
37,70 |
14,94 |
-18,64 |
40,01 |
Chiron |
|
|
|
|
|
|
|
|
|
|
|
|
|
|
|
|
|
|
|
|
Sextile: Orb Factor: +- 4 |
|
|
|
|
|
|
|
|
|
|
|
|
||
|
Sun |
|
|
|
|
|
|
|
|
|
|
|
|
|
|
|
16,80 |
Moon |
|
|
|
|
|
|
|
|
|
|
|
|
|
|
|
0,27 |
Mercury |
|
|
|
|
|
|
|
|
|
|
|
|
|
|
17,39 |
-4,01 |
Venus |
|
|
|
|
|
|
|
|
|
|
|
|
-49,58 |
41,48 |
47,28 |
20,49 |
Mars |
|
|
|
|
|
|
|
|
|
|
|
37,15 |
27,96 |
-17,71 |
-33,69 |
-35,34 |
Jupiter |
|
|
|
|
|
|
|
|
|
|
-5,62 |
22,24 |
28,23 |
8,32 |
-37,56 |
-3,30 |
Saturn |
|
|
|
|
|
|
|
|
|
-30,29 |
18,95 |
-26,28 |
-30,48 |
23,98 |
-38,61 |
15,30 |
Uranus |
|
|
|
|
|
|
|
|
25,41 |
13,14 |
16,85 |
-17,13 |
18,80 |
-1,68 |
1,95 |
-0,28 |
Neptune |
|
|
|
|
|
|
|
-27,79 |
-47,71 |
-22,42 |
-45,69 |
-8,17 |
14,31 |
-29,55 |
-34,19 |
-0,05 |
Pluto |
|
|
|
|
|
|
21,74 |
39,06 |
-26,48 |
33,36 |
42,46 |
10,23 |
-31,51 |
-2,37 |
42,18 |
1,67 |
N Node |
|
|
|
|
|
4,96 |
-51,88 |
-28,86 |
-20,70 |
-1,81 |
-30,43 |
-12,68 |
26,75 |
0,47 |
-34,37 |
-43,95 |
Chiron |
|
|
|
|
|
|
|
|
|
|
|
|
|
|
|
|
|
|
|
|
Quintile: Orb Factor: +- 2 |
|
|
|
|
|
|
|
|
|
|
|
|
||
|
Sun |
|
|
|
|
|
|
|
|
|
|
|
|
|
|
|
30,51 |
Moon |
|
|
|
|
|
|
|
|
|
|
|
|
|
|
|
37,36 |
Mercury |
|
|
|
|
|
|
|
|
|
|
|
|
|
|
15,26 |
42,59 |
Venus |
|
|
|
|
|
|
|
|
|
|
|
|
-27,12 |
26,68 |
-38,02 |
-42,98 |
Mars |
|
|
|
|
|
|
|
|
|
|
|
6,13 |
24,68 |
-20,45 |
-13,31 |
23,58 |
Jupiter |
|
|
|
|
|
|
|
|
|
|
-16,07 |
-36,70 |
31,39 |
40,38 |
19,96 |
-20,59 |
Saturn |
|
|
|
|
|
|
|
|
|
-41,54 |
-22,26 |
24,51 |
51,42 |
-47,61 |
48,33 |
-4,35 |
Uranus |
|
|
|
|
|
|
|
|
-42,34 |
-12,74 |
-27,41 |
24,01 |
29,98 |
-23,08 |
-45,76 |
-15,08 |
Neptune |
|
|
|
|
|
|
|
52,82 |
-3,61 |
-46,04 |
-22,62 |
11,02 |
-18,79 |
-31,78 |
29,69 |
-5,44 |
Pluto |
|
|
|
|
|
|
29,31 |
42,26 |
-5,18 |
11,13 |
-4,35 |
17,49 |
42,24 |
-35,71 |
1,74 |
-50,19 |
N Node |
|
|
|
|
|
-11,30 |
27,86 |
5,38 |
37,32 |
10,33 |
24,01 |
29,20 |
31,20 |
-8,42 |
15,86 |
-48,84 |
Chiron |
|
|
|
|
|
|
|
|
|
|
|
|
|
|
|
|
|
|
|
|
Square: Orb Factor: +- 6 |
|
|
|
|
|
|
|
|
|
|
|
|
||
|
Sun |
|
|
|
|
|
|
|
|
|
|
|
|
|
|
|
41,95 |
Moon |
|
|
|
|
|
|
|
|
|
|
|
|
|
|
|
38,20 |
Mercury |
|
|
|
|
|
|
|
|
|
|
|
|
|
|
-27,88 |
|
Venus |
|
|
|
|
|
|
|
|
|
|
|
|
-42,96 |
-32,16 |
-17,28 |
-23,99 |
Mars |
|
|
|
|
|
|
|
|
|
|
|
-33,40 |
-45,83 |
28,02 |
50,81 |
22,15 |
Jupiter |
|
|
|
|
|
|
|
|
|
|
35,73 |
13,93 |
21,63 |
23,57 |
-42,51 |
47,28 |
Saturn |
|
|
|
|
|
|
|
|
|
9,21 |
8,59 |
-5,68 |
-13,40 |
-40,83 |
-1,97 |
-34,76 |
Uranus |
|
|
|
|
|
|
|
|
32,69 |
27,08 |
-6,41 |
38,18 |
-2,15 |
-41,10 |
26,26 |
2,82 |
Neptune |
|
|
|
|
|
|
|
-30,40 |
-39,92 |
-18,61 |
0,23 |
-26,88 |
-29,40 |
-16,55 |
-6,31 |
-0,01 |
Pluto |
|
|
|
|
|
|
-11,35 |
14,76 |
-15,61 |
-39,27 |
29,74 |
-27,28 |
20,22 |
-45,14 |
13,32 |
38,38 |
N Node |
|
|
|
|
|
35,36 |
43,15 |
-47,02 |
-28,47 |
12,60 |
-13,73 |
0,06 |
-3,57 |
12,60 |
-48,47 |
-39,04 |
Chiron |
|
|
|
|
|
|
|
|
|
|
|
|
|
|
|
|
|
|
|
|
Trine: Orb Factor: +- 6 |
|
|
|
|
|
|
|
|
|
|
|
|
||
|
Sun |
|
|
|
|
|
|
|
|
|
|
|
|
|
|
|
-38,35 |
Moon |
|
|
|
|
|
|
|
|
|
|
|
|
|
|
|
-22,02 |
Mercury |
|
|
|
|
|
|
|
|
|
|
|
|
|
|
-4,36 |
|
Venus |
|
|
|
|
|
|
|
|
|
|
|
|
17,20 |
51,68 |
-22,74 |
29,25 |
Mars |
|
|
|
|
|
|
|
|
|
|
|
-4,97 |
-6,59 |
-5,27 |
-5,57 |
-48,83 |
Jupiter |
|
|
|
|
|
|
|
|
|
|
-32,12 |
-26,21 |
18,70 |
-3,49 |
-39,83 |
26,50 |
Saturn |
|
|
|
|
|
|
|
|
|
27,65 |
26,45 |
45,80 |
6,07 |
-19,34 |
39,68 |
-24,41 |
Uranus |
|
|
|
|
|
|
|
|
-11,55 |
45,69 |
38,73 |
-424,00 |
-6,30 |
7,86 |
-9,96 |
8,15 |
Neptune |
|
|
|
|
|
|
|
7,90 |
26,93 |
115,00 |
-49,38 |
15,86 |
34,90 |
408,00 |
-582,00 |
0,00 |
Pluto |
|
|
|
|
|
|
-35,85 |
-11,42 |
1,53 |
46,43 |
-25,94 |
-47,23 |
-51,53 |
46,21 |
26,31 |
-23,47 |
N Node |
|
|
|
|
|
31,96 |
-44,97 |
-27,98 |
-9,55 |
1,22 |
-8,58 |
-0,16 |
38,98 |
-6,24 |
0,64 |
-45,06 |
Chiron |
|
|
|
|
|
|
|
|
|
|
|
|
|
|
|
|
|
|
|
|
Sesquiquadrate: Orb Factor: +- 2 |
|
|
|
|
|
|
|
|
|
|
|
|
||
|
Sun |
|
|
|
|
|
|
|
|
|
|
|
|
|
|
|
-45,76 |
Moon |
|
|
|
|
|
|
|
|
|
|
|
|
|
|
|
-2,04 |
Mercury |
|
|
|
|
|
|
|
|
|
|
|
|
|
|
-32,13 |
|
Venus |
|
|
|
|
|
|
|
|
|
|
|
|
-53,64 |
-23,13 |
-38,85 |
-9,84 |
Mars |
|
|
|
|
|
|
|
|
|
|
|
-1,63 |
-48,56 |
-44,53 |
42,96 |
45,97 |
Jupiter |
|
|
|
|
|
|
|
|
|
|
17,71 |
-13,74 |
26,70 |
-19,68 |
49,71 |
-36,09 |
Saturn |
|
|
|
|
|
|
|
|
|
-9,26 |
-0,28 |
-47,86 |
40,80 |
-48,07 |
-21,42 |
-5,69 |
Uranus |
|
|
|
|
|
|
|
|
18,83 |
52,60 |
26,14 |
46,81 |
-21,20 |
39,23 |
31,14 |
-43,37 |
Neptune |
|
|
|
|
|
|
|
-16,88 |
26,93 |
8,53 |
24,70 |
12,12 |
23,35 |
49,64 |
3,14 |
-52,49 |
Pluto |
|
|
|
|
|
|
-6,93 |
-15,89 |
27,39 |
47,17 |
-32,02 |
16,35 |
-20,05 |
-12,06 |
-4,74 |
32,41 |
N Node |
|
|
|
|
|
-35,81 |
-12,82 |
6,75 |
28,22 |
-27,51 |
-36,91 |
-24,44 |
-45,69 |
-17,61 |
10,96 |
8,58 |
Chiron |
|
|
|
|
|
|
|
|
|
|
|
|
|
|
|
|
|
|
|
|
BiQuintile: Orb Factor: +- 2 |
|
|
|
|
|
|
|
|
|
|
|
|
||
|
Sun |
|
|
|
|
|
|
|
|
|
|
|
|
|
|
|
41,21 |
Moon |
|
|
|
|
|
|
|
|
|
|
|
|
|
|
|
49,30 |
Mercury |
|
|
|
|
|
|
|
|
|
|
|
|
|
|
-31,86 |
|
Venus |
|
|
|
|
|
|
|
|
|
|
|
|
-34,41 |
32,13 |
-49,94 |
-25,31 |
Mars |
|
|
|
|
|
|
|
|
|
|
|
2,51 |
13,97 |
-53,18 |
-24,49 |
28,68 |
Jupiter |
|
|
|
|
|
|
|
|
|
|
-37,22 |
-9,85 |
-43,32 |
-44,57 |
5,70 |
11,23 |
Saturn |
|
|
|
|
|
|
|
|
|
7,94 |
-7,37 |
24,69 |
30,21 |
-12,75 |
28,04 |
-41,86 |
Uranus |
|
|
|
|
|
|
|
|
48,24 |
-43,03 |
-52,62 |
-12,53 |
33,23 |
27,28 |
12,36 |
6,17 |
Neptune |
|
|
|
|
|
|
|
22,84 |
-17,65 |
23,17 |
48,40 |
-10,21 |
44,84 |
47,63 |
0,89 |
27,07 |
Pluto |
|
|
|
|
|
|
-11,93 |
44,87 |
-50,53 |
-8,90 |
50,25 |
19,88 |
-13,01 |
-36,70 |
-11,66 |
19,88 |
N Node |
|
|
|
|
|
-45,66 |
6,75 |
15,39 |
-2,42 |
24,49 |
11,88 |
-18,66 |
-21,82 |
-7,43 |
-22,63 |
52,00 |
Chiron |
|
|
|
|
|
|
|
|
|
|
|
|
|
|
|
|
|
|
|
|
Quincunx: Orb Factor: +- 2 |
|
|
|
|
|
|
|
|
|
|
|
|
||
|
Sun |
|
|
|
|
|
|
|
|
|
|
|
|
|
|
|
-24,88 |
Moon |
|
|
|
|
|
|
|
|
|
|
|
|
|
|
|
-12,74 |
Mercury |
|
|
|
|
|
|
|
|
|
|
|
|
|
|
-7,64 |
|
Venus |
|
|
|
|
|
|
|
|
|
|
|
|
32,21 |
27,36 |
6,22 |
-44,19 |
Mars |
|
|
|
|
|
|
|
|
|
|
|
-32,64 |
-13,85 |
7,65 |
-41,34 |
51,43 |
Jupiter |
|
|
|
|
|
|
|
|
|
|
-5,04 |
-29,24 |
-31,82 |
52,68 |
37,33 |
2,70 |
Saturn |
|
|
|
|
|
|
|
|
|
-32,67 |
-52,83 |
7,86 |
-27,15 |
33,23 |
-44,81 |
-21,94 |
Uranus |
|
|
|
|
|
|
|
|
8,82 |
-0,54 |
39,92 |
-31,65 |
23,96 |
-35,02 |
29,42 |
0,37 |
Neptune |
|
|
|
|
|
|
|
24,15 |
-10,08 |
9,59 |
-11,51 |
-6,58 |
-45,76 |
17,06 |
1,44 |
-40,01 |
Pluto |
|
|
|
|
|
|
44,95 |
-52,33 |
-8,03 |
-12,68 |
28,13 |
11,83 |
-18,24 |
-3,33 |
15,13 |
-30,15 |
N Node |
|
|
|
|
|
-20,58 |
5,60 |
-33,98 |
1,20 |
-5,84 |
-33,77 |
-2,07 |
13,61 |
-15,11 |
-22,69 |
-24,57 |
Chiron |
|
|
|
|
|
|
|
|
|
|
|
|
|
|
|
|
|
|
|
|
Opposite: Orb Factor: +- 6 |
|
|
|
|
|
|
|
|
|
|
|
|
||
|
Sun |
|
|
|
|
|
|
|
|
|
|
|
|
|
|
|
43,28 |
Moon |
|
|
|
|
|
|
|
|
|
|
|
|
|
|
|
-36,22 |
Mercury |
|
|
|
|
|
|
|
|
|
|
|
|
|
|
40,72 |
|
Venus |
|
|
|
|
|
|
|
|
|
|
|
|
14,35 |
-19,50 |
16,13 |
-46,85 |
Mars |
|
|
|
|
|
|
|
|
|
|
|
-18,72 |
17,34 |
-51,63 |
19,69 |
-42,61 |
Jupiter |
|
|
|
|
|
|
|
|
|
|
33,31 |
-5,48 |
-13,22 |
-32,74 |
-34,83 |
-33,85 |
Saturn |
|
|
|
|
|
|
|
|
|
26,16 |
46,80 |
-36,28 |
-48,47 |
48,52 |
-39,01 |
-12,95 |
Uranus |
|
|
|
|
|
|
|
|
-8,99 |
-48,31 |
-13,48 |
30,67 |
6,16 |
-3,44 |
-49,99 |
1,19 |
Neptune |
|
|
|
|
|
|
|
9,50 |
-8,08 |
48,44 |
-46,09 |
39,69 |
2,85 |
-5,92 |
0,01 |
57,18 |
Pluto |
|
|
|
|
|
|
22,78 |
-12,69 |
-49,14 |
35,42 |
0,24 |
-17,43 |
6,85 |
7,33 |
42,70 |
-51,66 |
N Node |
|
|
|
|
|
-29,79 |
40,19 |
-31,17 |
-39,03 |
-43,30 |
48,23 |
-0,05 |
0,00 |
-11,42 |
-22,23 |
-2,60 |
Chiron |
|
|
|
|
|
|
|
|
|
|
|
|
|
|
|
|
|
|
|
|
All Aspects |
|
|
|
|
|
|
|
|
|
|
|
|
|
|
|
Sun |
|
|
|
|
|
|
|
|
|
|
|
|
|
|
|
12,13 |
Moon |
|
|
|
|
|
|
|
|
|
|
|
|
|
|
10,21 |
-50,11 |
Mercury |
|
|
|
|
|
|
|
|
|
|
|
|
|
-50,41 |
-20,86 |
-6,64 |
Venus |
|
|
|
|
|
|
|
|
|
|
|
|
42,43 |
-45,41 |
-22,99 |
-12,79 |
Mars |
|
|
|
|
|
|
|
|
|
|
|
-40,92 |
29,85 |
-23,14 |
-8,25 |
-34,37 |
Jupiter |
|
|
|
|
|
|
|
|
|
|
-13,11 |
-9,56 |
27,41 |
-29,06 |
42,60 |
-42,47 |
Saturn |
|
|
|
|
|
|
|
|
|
-33,33 |
-31,64 |
-42,32 |
47,75 |
-10,70 |
-14,82 |
-4,85 |
Uranus |
|
|
|
|
|
|
|
|
41,62 |
-25,67 |
-31,98 |
50,75 |
12,80 |
-2,99 |
2,17 |
-37,98 |
Neptune |
|
|
|
|
|
|
|
14,88 |
-20,73 |
17,25 |
13,71 |
38,25 |
30,00 |
-41,65 |
16,67 |
-7,49 |
Pluto |
|
|
|
|
|
|
-37,37 |
-19,00 |
-30,28 |
44,88 |
16,33 |
15,93 |
-27,80 |
-2,59 |
37,63 |
12,75 |
N Node |
|
|
|
|
|
46,36 |
15,15 |
-50,38 |
-9,50 |
9,84 |
-46,13 |
-22,87 |
-0,06 |
-18,19 |
31,43 |
-3,78 |
Chiron |
|
|
|
Below are some counts of combinations of planet in house and sign for the ADB category astrologer. The first combination of Sun in House 1 and Aries is 13, implies that we had 13 cases of a Sun being in Aries and in the first house. Aries thus refers to the Sun sign, not to a house-cusp. The house-cusp could also be in Pisces.
A quick scan reveals found values between 2 cases of Sun in Pisces in H7 up to 28 cases for Sun in Leo and H12 with a mean of 13. But how significant are they?
|
|
|
Aries |
Tau |
Gemini |
Cancer |
Leo |
Virgo |
Libra |
Scorp |
Sag |
Cap |
Aqua |
Pisces |
Total |
|
Sun |
H1 |
13 |
13 |
11 |
12 |
14 |
10 |
17 |
13 |
10 |
14 |
25 |
17 |
169 |
|
H2 |
14 |
10 |
8 |
5 |
12 |
12 |
13 |
11 |
15 |
20 |
22 |
14 |
156 |
|
|
H3 |
18 |
6 |
9 |
13 |
14 |
5 |
6 |
12 |
22 |
21 |
19 |
16 |
161 |
|
|
H4 |
16 |
10 |
5 |
7 |
8 |
5 |
10 |
12 |
18 |
22 |
15 |
16 |
144 |
|
|
H5 |
12 |
5 |
12 |
7 |
9 |
9 |
12 |
15 |
8 |
17 |
11 |
9 |
126 |
|
|
H6 |
11 |
10 |
8 |
9 |
5 |
10 |
8 |
14 |
11 |
13 |
11 |
9 |
119 |
|
|
H7 |
11 |
12 |
11 |
11 |
7 |
13 |
13 |
9 |
10 |
8 |
9 |
2 |
116 |
|
|
H8 |
14 |
12 |
15 |
17 |
15 |
16 |
10 |
12 |
10 |
11 |
11 |
3 |
146 |
|
|
H9 |
12 |
12 |
14 |
15 |
16 |
9 |
12 |
11 |
14 |
5 |
13 |
15 |
148 |
|
|
H10 |
22 |
15 |
13 |
15 |
15 |
23 |
14 |
16 |
10 |
8 |
18 |
14 |
183 |
|
|
H11 |
14 |
25 |
26 |
22 |
13 |
15 |
11 |
9 |
11 |
13 |
17 |
14 |
190 |
|
|
H12 |
20 |
17 |
23 |
25 |
28 |
14 |
19 |
12 |
13 |
7 |
13 |
18 |
209 |
|
|
Total |
177 |
147 |
155 |
158 |
156 |
141 |
145 |
146 |
152 |
159 |
184 |
147 |
1867 |
|
When you use Binomial_distribution_for_astrology.xlsx or Binomial_distribution_for_astrology.ods you could fill in the found value under case X found and evaluate other features like Z scores and the expected effect size range assuming a normal distribution. There are 12 signs and 12 planets, so the combined risk involved with all of them should be 1/144. We selected 1867 ADB astrologers and each combination of planet in sign and house (here the Placidus house system) should have an expected value np of 1867/144 is 13 (12,97).
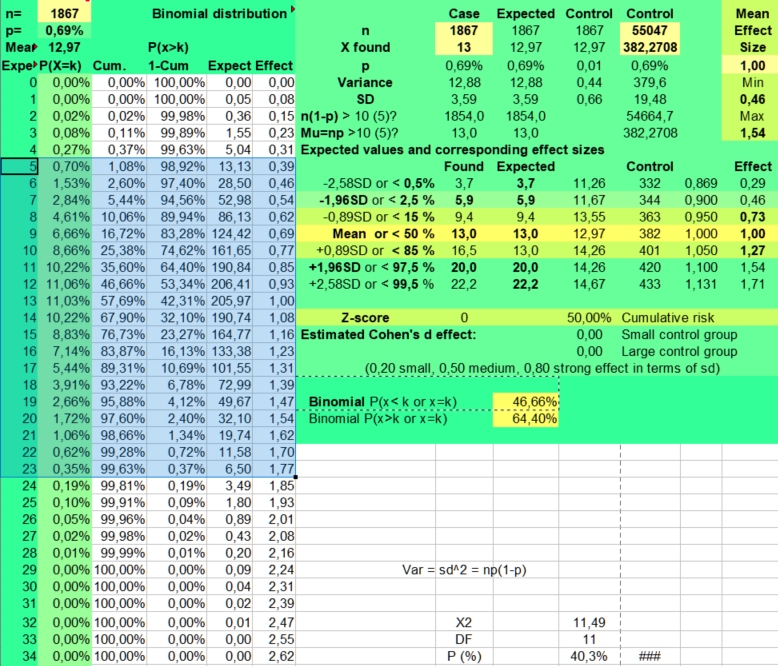 As
np and n(1-p) are larger than 10, we could expect a near normal
distribution for the personal planets with a standard deviation (SD)
of 3,59. From this confidence intervals dealing with the sampling
error can be estimated as was done in green table on the right.
Variance was predicted by the simple formula:
As
np and n(1-p) are larger than 10, we could expect a near normal
distribution for the personal planets with a standard deviation (SD)
of 3,59. From this confidence intervals dealing with the sampling
error can be estimated as was done in green table on the right.
Variance was predicted by the simple formula:
Var = sd^2 = np(1-p)
Using the normal approach of the binomial distribution effect sizes between 0,46 and 1,54 corresponding to values from 6 to 20 could be expected in 95 % of random ADB samples.
But because we looked at large 12 times 12 tables, using a 99 % confidence interval would be more reasonable. It is estimated as 4 to 22 having an effect size range of 0,29 - 1,71.
Using the discrete binomial distribution (n is 1867, p is 1/144) a 95 % confidence interval of expected values would again be 6 - 20, with values 0 - 5 being found in only 1,08 % of random ADB samples and values of 21 and above in only 2,40 % of samples.
A value of 6 (risk 1,53%) would thus be a borderline case. The in 96,5 % of random ADB samples expected values 6 - 20 have effect sizes from 0,46 - 1,54. Larger or smaller found effect sizes would only have a risk of 3,48 % being produced by chance.
The binomial 99 % confidence interval would be from 5 - 23 corresponding to effect sizes of 0,39 - 1,77. Only values from 0- 4 having a risk of 0,37 % and values of 24 and more a risk of 0,37 % would be significant.
In the picture of the binomial distribution the expected range using an alpha of 1 % of 5 - 23 is stressed. The in practice used binomial alpha is 0,37 + 0,37 = 0,74 %. We left thus out borderline low and high values like 6 to prevent unneeded discussions on borderline questions. So, to be significant using the 99 % confidence interval (alpha is 0,01), a found value should have a risk of P(x is k or lower) < 0,5 % under the Cum column or P (x is larger than k-1) < 0,5 % under the 1-cum column.
Notice that in a 12*12 table of 144 elements on average some 144/20 is 7,1 false positives could be found using an alpha of 5 %. This is unacceptable when doing data-mining. But only at average 1,44 false positives could be expected when using an alpha of 1 %. So we focused on them.
The also presented normal approach of the binomial distribution, predicting virtual values from 3,7 -22,2 having the same mean value (12,97) is shown. But its estimates does not take into account the skewness of the binomial distribution, that has as the most frequently expected value 12 (risk 11,06 %) and not the expected mean (11,22 %). For this reason the Z score of 0 (cumulative risk 50 %) of the normally expected mean was not found back in the Cumulative Binomial Distribution score of 46,66 %. When in doubt or when calculating the risks involved with astrological events having an expected value of 10 or lower, the binomial distribution is the best model.
Remember that the sampling error we try to deal with, could as well hide significant effects (type 2 error) as produce false positives (type 1 error). But it cannot deal with the many forms of bias. Just an example.
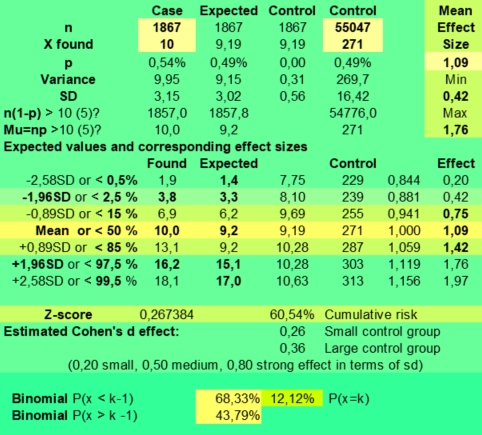 Suppose
that you had bought a book studying the 100 greatest ADB astrologers
and that the author would have noticed by
the way that professional astrologers very often had Sun
in Sagittarius and in H10. Seven
out of hundred had this combination against maybe at most one
expected with a probability of only 1/144. It would be a clear case
for astrological symbolism and thus worth to mention explicitly in an
astrology book. And you would remember it. As the findings fitted
your shared ideas about astrological symbolism.
Suppose
that you had bought a book studying the 100 greatest ADB astrologers
and that the author would have noticed by
the way that professional astrologers very often had Sun
in Sagittarius and in H10. Seven
out of hundred had this combination against maybe at most one
expected with a probability of only 1/144. It would be a clear case
for astrological symbolism and thus worth to mention explicitly in an
astrology book. And you would remember it. As the findings fitted
your shared ideas about astrological symbolism.
Question: Could there be some publication bias and selective attention involved in here?
Answer: Quite likely, as we do not expect that his in astrological symbolism interested audience would buy the book when it annoyed its readers with the usually found and boring them statistical facts that did not fit their ideas about astrological symbolism.
The problem or virtue involved in here is that you will just by chance encounter enough of the by you expected unlikely coincidences in the ADB when doing some data-mining. See my notes on Assumptionless research versus cherry picking in 79 art critics and the related Wikipedia article on Suppression of evidence:
But ignorance is not a verdict. It is a virtue of any brand new day in your brave new world.
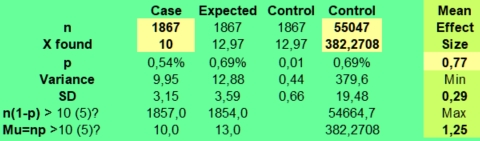 After
reading the book about the top 100 astrologers and their magical
tricks to deal with reality, you might be a little bit disappointed
that our sample of ADB astrologers only had 10 times Sun in
Sagittarius and in H10 against 13 expected with a negative effect
size 0,77 (0,29 - 1,25).
After
reading the book about the top 100 astrologers and their magical
tricks to deal with reality, you might be a little bit disappointed
that our sample of ADB astrologers only had 10 times Sun in
Sagittarius and in H10 against 13 expected with a negative effect
size 0,77 (0,29 - 1,25).
Would that be a good reason to suppress our freedom of speech? No, just ignoring the counterevidence would be enough. As nobody would be on trial yet. For you and your astrological minded friends existed other rules.
More important, you could correctly reason that a reverse effect size with a wide confidence interval does not imply per se a negative effect. And the 99 % confidence interval would be 0,14 - 1,40. So your story teller still could be somehow right when predicting a positive effect. And their might be some bias involved with it. Indeed, the actual found effect size for Sun in Sagittarius in H10 was 1,09 (range 0,42 - 1,76), as 271 cases were found in ADB and not the expected 55047/144 is 382,3. Of course both outcomes would not be statically significant nor relevant as they had possible effect sizes no one could for certain predict with. But it could lead to selective attention of more prejudiced persons, that prefer to see their tiny part of the story, without taking into account the rest of the found values.
Let us now focus on the the highest and lowest values of each table of 144 values and see if they are within or outside of the expected range.
Are there found values that fall clearly outside the by the exact binomial distribution predicted 99 % confidence interval of 5 to 23 corresponding to effect sizes of 0,39 - 1,77? Six values were found, against 0-4 expected. Do we have a case for astrology here?
|
|
|
Aries |
Tau |
Gemini |
Cancer |
Leo |
Virgo |
Libra |
Scorp |
Sag |
Cap |
|
Pisces |
Total |
|
Sun |
H1 |
13 |
13 |
11 |
12 |
14 |
10 |
17 |
13 |
10 |
14 |
25 |
17 |
169 |
|
H2 |
14 |
10 |
8 |
5 |
12 |
12 |
13 |
11 |
15 |
20 |
22 |
14 |
156 |
|
|
H3 |
18 |
6 |
9 |
13 |
14 |
5 |
6 |
12 |
22 |
21 |
19 |
16 |
161 |
|
|
H4 |
16 |
10 |
5 |
7 |
8 |
5 |
10 |
12 |
18 |
22 |
15 |
16 |
144 |
|
|
H5 |
12 |
5 |
12 |
7 |
9 |
9 |
12 |
15 |
8 |
17 |
11 |
9 |
126 |
|
|
H6 |
11 |
10 |
8 |
9 |
5 |
10 |
8 |
14 |
11 |
13 |
11 |
9 |
119 |
|
|
H7 |
11 |
12 |
11 |
11 |
7 |
13 |
13 |
9 |
10 |
8 |
9 |
2 |
116 |
|
|
H8 |
14 |
12 |
15 |
17 |
15 |
16 |
10 |
12 |
10 |
11 |
11 |
3 |
146 |
|
|
H9 |
12 |
12 |
14 |
15 |
16 |
9 |
12 |
11 |
14 |
5 |
13 |
15 |
148 |
|
|
H10 |
22 |
15 |
13 |
15 |
15 |
23 |
14 |
16 |
10 |
8 |
18 |
14 |
183 |
|
|
H11 |
14 |
25 |
26 |
22 |
13 |
15 |
11 |
9 |
11 |
13 |
17 |
14 |
190 |
|
|
H12 |
20 |
17 |
23 |
25 |
28 |
14 |
19 |
12 |
13 |
7 |
13 |
18 |
209 |
|
|
Total |
177 |
147 |
155 |
158 |
156 |
141 |
145 |
146 |
152 |
159 |
184 |
147 |
1867 |
|
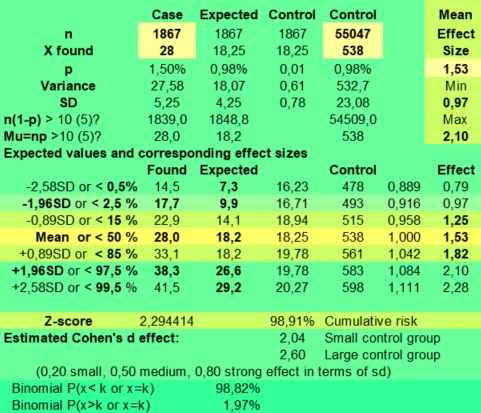 The
lowest score of 2 against 13 expected is for Sun in Pisces and H7.
The risk of getting a 2 or lower is 0,02 % (under Cum), so this is
for certain a hit. The Z score of -3 makes clear is far away from the
mean (3 standard deviations). The estimated effect size is 0,15. It
was 0,19 (0 - 0,45) when compared to the ADB (314 found), which is
still -2,6 SD away from the mean and had an accumulated binomial risk
of 0,16 %, which is very significant. We will label them red.
The
lowest score of 2 against 13 expected is for Sun in Pisces and H7.
The risk of getting a 2 or lower is 0,02 % (under Cum), so this is
for certain a hit. The Z score of -3 makes clear is far away from the
mean (3 standard deviations). The estimated effect size is 0,15. It
was 0,19 (0 - 0,45) when compared to the ADB (314 found), which is
still -2,6 SD away from the mean and had an accumulated binomial risk
of 0,16 %, which is very significant. We will label them red.
The highest score of 28 against 13 expected is for Sun in Leo in H12. The risk of getting a value of 28 or higher is only 0,02 % in the binomial, so we have a hit when expecting a risk of 1/144. The Z score is 4,2 and the effects size 2,16 (1,37 - 2,95 expected in most cases).
But when using the ADB as a control group (np = 1867* 538/55047 is 18,25), an effect size of 1,53 (0,97 - 2,10) was found, which is only significant at the 95 % level, having an expected range of 9,9 - 26,6 in the calculator on the right. Also P (x > 27) is 1,97 % under the binomial distribution (n = 1867, p = 538/55047), which is only significant at the 95 % level. The label remains yellow.
Sun in Pisces and H8 has a value of 3 against 13 expected (effect size 0,23, range 0-0,49). The cumulative binomial risk is 0,11 %. But when the ADB control group is used (348 found), the risk becomes 0,25 (0-0,54). The binomial risk of P(x<4) is 0,26 %, thus still very significant.
Sun in Taurus and H11 found 25 times against 13 times expected (effect size 1,93, range 1,18 - 2,68). But when comparing to the ADB control group (512 found) an effect size of 1, 44 (range 0,88 - 2,00) was found, which is not significant at the 95 % level.
Sun in Cancer and H12 found 25 times has the effect size of 1,93. But when comparing to the ADB control group (576 found) an effect size of 1,28 (range 0,78 - 1,78) was found, which is not significant at the 95 % level.
What we see is that seemingly large effect sizes can disappear when we use a larger control group. The reverse can also occur as we can see in the Sun in Sagittarius in 9 case below. We had 14 cases of Sun in Sagittarius in H9. We expected 13 of them, but in the ADB 245 were found. So the expected value was 8,31 (range 7,27 - 9,35) . The effect size thus became 1,68 (0,81 - 2,56), which is not yet statistical significant (Px>13=4,39 %). But is still has the second highest effect size found in the table below.
|
|
|
Aries |
Tau |
Gemini |
Cancer |
Leo |
Virgo |
Libra |
Scorp |
Sag |
Cap |
Aqua |
Pisces |
Total |
|
Sun |
H1 |
0,88 |
0,97 |
0,97 |
1,20 |
1,05 |
0,74 |
1,08 |
0,87 |
0,59 |
0,76 |
1,45 |
0,99 |
11,54 |
|
in |
H2 |
1,00 |
0,79 |
0,77 |
0,55 |
1,03 |
0,85 |
0,87 |
0,72 |
0,85 |
1,09 |
1,34 |
0,97 |
10,84 |
|
|
H3 |
1,38 |
0,51 |
0,87 |
1,21 |
1,27 |
0,44 |
0,45 |
0,82 |
1,47 |
1,30 |
1,19 |
1,14 |
12,04 |
|
|
H4 |
1,31 |
1,03 |
0,56 |
0,82 |
0,74 |
0,43 |
0,79 |
0,96 |
1,31 |
1,36 |
1,02 |
1,15 |
11,49 |
|
|
H5 |
1,11 |
0,52 |
1,34 |
0,78 |
0,94 |
0,88 |
0,89 |
1,21 |
0,59 |
1,26 |
0,86 |
0,71 |
11,11 |
|
|
H6 |
1,07 |
1,08 |
0,92 |
1,00 |
0,56 |
0,92 |
0,65 |
1,09 |
0,87 |
1,04 |
0,78 |
0,69 |
10,68 |
|
|
H7 |
0,92 |
0,86 |
0,75 |
0,78 |
0,52 |
1,04 |
1,17 |
0,99 |
1,16 |
0,94 |
0,91 |
0,19 |
10,23 |
|
|
H8 |
1,08 |
0,83 |
1,03 |
1,12 |
1,04 |
1,22 |
1,06 |
1,44 |
1,35 |
1,18 |
1,18 |
0,25 |
12,78 |
|
|
H9 |
0,90 |
0,83 |
0,84 |
1,02 |
1,18 |
0,77 |
1,05 |
1,08 |
1,68 |
0,62 |
1,50 |
1,33 |
12,81 |
|
|
H10 |
1,29 |
0,87 |
0,74 |
0,76 |
0,86 |
1,72 |
1,15 |
1,49 |
1,09 |
0,77 |
1,35 |
1,00 |
13,10 |
|
|
H11 |
0,92 |
1,44 |
1,30 |
1,12 |
0,72 |
1,04 |
0,84 |
0,78 |
1,17 |
1,30 |
1,49 |
0,95 |
13,06 |
|
|
H12 |
1,32 |
0,94 |
1,16 |
1,28 |
1,53 |
0,88 |
1,36 |
1,00 |
1,35 |
0,73 |
1,06 |
1,19 |
13,81 |
|
Total |
|
13,19 |
10,68 |
11,26 |
11,62 |
11,45 |
10,92 |
11,38 |
12,45 |
13,48 |
12,35 |
14,14 |
10,57 |
143,48 |
What were the found values for the fast moving moon? Values from 6 - 20 having effect sizes from 0,46 - 1,54 could be expected in 95 % of cases if we had a risk of 1/144. The binomial 99 % confidence interval would be from 5 - 23 corresponding to effect sizes of 0,39 - 1,77.
Strange enough, values below 6 were not found. Seven values were above 20 and three were above 23.
|
|
|
Aries |
Tau |
Gemini |
Cancer |
Leo |
Virgo |
Libra |
Scorp |
Sag |
Cap |
|
Pisces |
Total |
|
Found Moon sign and house |
H1 |
11 |
7 |
6 |
11 |
14 |
11 |
8 |
11 |
12 |
24 |
12 |
17 |
144 |
|
H2 |
12 |
12 |
12 |
9 |
10 |
12 |
11 |
14 |
19 |
15 |
25 |
12 |
163 |
|
|
H3 |
13 |
15 |
10 |
6 |
7 |
15 |
18 |
16 |
16 |
17 |
24 |
12 |
169 |
|
|
H4 |
15 |
9 |
15 |
8 |
13 |
16 |
15 |
13 |
13 |
21 |
17 |
19 |
174 |
|
|
H5 |
9 |
9 |
7 |
11 |
7 |
13 |
9 |
16 |
15 |
11 |
12 |
9 |
128 |
|
|
H6 |
12 |
10 |
10 |
6 |
10 |
8 |
14 |
11 |
14 |
15 |
16 |
17 |
143 |
|
|
H7 |
13 |
11 |
20 |
19 |
11 |
13 |
11 |
8 |
10 |
12 |
11 |
15 |
154 |
|
|
H8 |
14 |
11 |
20 |
14 |
10 |
8 |
14 |
12 |
15 |
6 |
11 |
9 |
144 |
|
|
H9 |
13 |
11 |
14 |
21 |
18 |
10 |
10 |
13 |
17 |
13 |
12 |
8 |
160 |
|
|
H10 |
14 |
12 |
21 |
23 |
9 |
10 |
14 |
10 |
13 |
7 |
11 |
16 |
160 |
|
|
H11 |
18 |
18 |
14 |
15 |
12 |
15 |
18 |
8 |
12 |
14 |
8 |
10 |
162 |
|
|
H12 |
17 |
20 |
12 |
23 |
17 |
12 |
9 |
9 |
10 |
10 |
13 |
14 |
166 |
|
|
Total |
161 |
145 |
161 |
166 |
138 |
143 |
151 |
141 |
166 |
165 |
172 |
158 |
1867 |
|
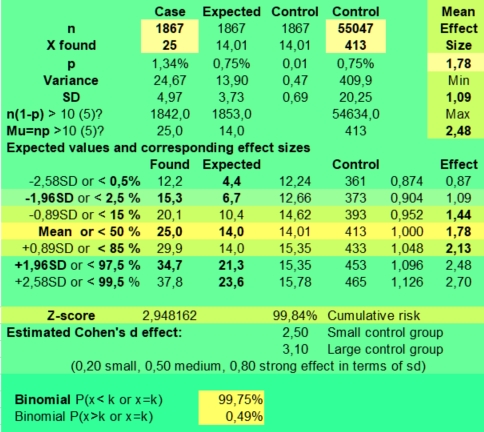 Moon
in Gemini in H1 and Moon in Cancer in H6
were found 6 times. The risk of getting a value of 6 or lower
is 2,60 % (a borderline case when dealing with the 95 % confidence
interval). The (expected) Z score is -1,94 (risk 2,61 %). But when
using the ADB control group both
have a not significant effect size of 0,66 (range 0,13 -
1,19).
Moon
in Gemini in H1 and Moon in Cancer in H6
were found 6 times. The risk of getting a value of 6 or lower
is 2,60 % (a borderline case when dealing with the 95 % confidence
interval). The (expected) Z score is -1,94 (risk 2,61 %). But when
using the ADB control group both
have a not significant effect size of 0,66 (range 0,13 -
1,19).
The highest found value of 25 against 13 expected was Moon in Aquarius in H2. It has as statically significant effect size of 1,93 (1,18- 2,68) assuming p =1/144. But when using the ADB control group (413 found), the effect size becomes 1,78 (1,09 - 2,48). Which is still statistical significant with a P(x>24) is 0,49 %. See the calculations on the right. But it still could be an expected value when doing data-mining.
The value of 24 of Moon in Capricorn in H1 has as an effect size of 1,85 (1,12- 2,59). The Z score is 3,1 and it would be statistically significant with p=1/144. But the ADB score was 506, yielding an effect size of 1,40 (0,84 - 1,95), which is not significant with P(x>23) is 6,77 %.
The value of 24 of Moon in Aquarius in H3 has the same effect size of 1,85, assuming p=1/144. But the ADB score was 495, yielding an effect size of 1,43 (0,86 - 2,00), which is not significant with P(x>23) is 5,60 %.
The values of 23 of Moon in Cancer in H10 has as statically significant effect size of 1,77 (1,05- 2,49). The ADB score was 477 yielding an effect size of 1,42 (0,84 - 2,00), which is not significant with P(x>22) is 6,31 %. The same for the value of 23 of Moon in Cancer in H12. The control group had 472 of them, diminishing the effect size to 1,44 (0,85 - 2,02), which is not significant with P(x>22) is 5,77 %.
We started our exploration of Moon in sign and house with values of 6 up to 25 against an expected mean of 13, promising rather large effect sizes. But on closer inspection using the ADB as a control group, less impressive effect sizes were found. The reason is that the values were not that uniformly distributed in the Placidus houses as we initially supposed.
|
|
|
Aries |
Tau |
Gemini |
Cancer |
Leo |
Virgo |
Libra |
Scorp |
Sag |
Cap |
Aqua |
Pisces |
Total |
|
|
H1 |
0,91 |
0,69 |
0,66 |
1,20 |
1,26 |
0,95 |
0,54 |
0,77 |
0,77 |
1,40 |
0,76 |
1,27 |
11,19 |
|
Effect |
H2 |
0,97 |
1,13 |
1,18 |
0,98 |
0,90 |
0,93 |
0,84 |
0,93 |
1,22 |
0,93 |
1,78 |
0,83 |
12,63 |
|
size |
H3 |
1,09 |
1,48 |
1,15 |
0,58 |
0,62 |
1,18 |
1,34 |
1,09 |
0,91 |
1,01 |
1,58 |
0,84 |
12,88 |
|
of |
H4 |
1,15 |
0,92 |
1,68 |
0,88 |
1,16 |
1,33 |
1,07 |
0,82 |
0,83 |
1,20 |
1,13 |
1,47 |
13,65 |
|
Moon |
H5 |
0,70 |
0,96 |
0,67 |
1,15 |
0,63 |
1,11 |
0,67 |
1,05 |
0,91 |
0,76 |
0,71 |
0,68 |
10,02 |
|
in |
H6 |
1,04 |
1,03 |
1,04 |
0,66 |
0,94 |
0,67 |
1,08 |
0,66 |
0,86 |
0,92 |
1,05 |
1,18 |
11,13 |
|
H |
H7 |
0,94 |
0,69 |
1,11 |
1,21 |
0,72 |
1,00 |
0,83 |
0,80 |
1,05 |
1,27 |
0,92 |
1,19 |
11,73 |
|
and |
H8 |
1,02 |
0,71 |
1,21 |
0,87 |
0,72 |
0,56 |
1,27 |
1,09 |
1,71 |
0,68 |
1,07 |
0,74 |
11,63 |
|
Sign |
H9 |
0,89 |
0,71 |
0,84 |
1,33 |
1,25 |
0,74 |
0,85 |
1,25 |
1,73 |
1,29 |
1,13 |
0,68 |
12,68 |
|
|
H10 |
0,99 |
0,77 |
1,32 |
1,42 |
0,59 |
0,79 |
1,13 |
0,99 |
1,32 |
0,72 |
1,08 |
1,19 |
12,32 |
|
|
H11 |
1,29 |
1,26 |
0,87 |
0,96 |
0,76 |
1,09 |
1,50 |
0,77 |
1,22 |
1,31 |
0,66 |
0,76 |
12,45 |
|
|
H12 |
1,18 |
1,21 |
0,68 |
1,44 |
1,08 |
0,93 |
0,75 |
0,80 |
0,97 |
1,05 |
1,22 |
1,20 |
12,49 |
|
Total |
|
12,17 |
11,54 |
12,42 |
12,66 |
10,64 |
11,29 |
11,89 |
11,02 |
13,51 |
12,54 |
13,11 |
12,02 |
144,80 |
With n is 55047 and p is 1/144 some 95 % of expected values should be between 11,67 and 14,26, so only fluctuating +/ - 10 % around the mean. Some 99 % of expected values should be between 11,26 and 14,67, fluctuating only some 13 % around the mean. You can find them under Expected values and corresponding effect sizes in the green calculator below.
|
|
|
Aries |
Tau |
Gemini |
Cancer |
Leo |
Virgo |
Libra |
Scorp |
Sag |
Cap |
Aqua |
Pisces |
Total |
|
Expected Moon |
H1 |
12,11 |
10,11 |
9,09 |
9,16 |
11,12 |
11,53 |
14,72 |
14,31 |
15,50 |
17,16 |
15,81 |
13,40 |
154,01 |
|
H2 |
12,31 |
10,65 |
10,14 |
9,19 |
11,09 |
12,85 |
13,06 |
15,13 |
15,64 |
16,11 |
14,01 |
14,38 |
154,56 |
|
|
H3 |
11,90 |
10,14 |
8,68 |
10,34 |
11,23 |
12,75 |
13,40 |
14,65 |
17,64 |
16,79 |
15,16 |
14,28 |
156,97 |
|
|
H4 |
13,02 |
9,84 |
8,92 |
9,12 |
11,19 |
12,01 |
13,97 |
15,77 |
15,60 |
17,47 |
15,02 |
12,96 |
154,90 |
|
|
H5 |
12,79 |
9,39 |
10,41 |
9,60 |
11,06 |
11,70 |
13,43 |
15,23 |
16,48 |
14,38 |
16,82 |
13,19 |
154,49 |
|
|
H6 |
11,57 |
9,67 |
9,60 |
9,16 |
10,65 |
12,01 |
12,92 |
16,65 |
16,25 |
16,38 |
15,19 |
14,41 |
154,46 |
|
|
H7 |
13,80 |
15,94 |
17,98 |
15,70 |
15,26 |
12,99 |
13,26 |
10,04 |
9,53 |
9,46 |
11,94 |
12,65 |
158,56 |
|
|
H8 |
13,77 |
15,60 |
16,52 |
16,11 |
13,94 |
14,24 |
11,02 |
11,06 |
8,75 |
8,82 |
10,31 |
12,24 |
152,39 |
|
|
H9 |
14,69 |
15,47 |
16,75 |
15,84 |
14,41 |
13,43 |
11,74 |
10,38 |
9,84 |
10,11 |
10,62 |
11,70 |
154,96 |
|
|
H10 |
14,11 |
15,64 |
15,91 |
16,18 |
15,23 |
12,62 |
12,41 |
10,07 |
9,84 |
9,67 |
10,17 |
13,46 |
155,30 |
|
|
H11 |
14,01 |
14,31 |
16,11 |
15,64 |
15,70 |
13,77 |
12,01 |
10,38 |
9,84 |
10,72 |
12,04 |
13,13 |
157,64 |
|
|
H12 |
14,41 |
16,59 |
17,67 |
16,01 |
15,74 |
12,89 |
11,97 |
11,23 |
10,31 |
9,56 |
10,68 |
11,70 |
158,76 |
|
|
Total |
158,49 |
153,34 |
157,78 |
152,05 |
156,63 |
152,79 |
153,91 |
154,90 |
155,20 |
156,63 |
157,78 |
157,51 |
1867,00 |
|
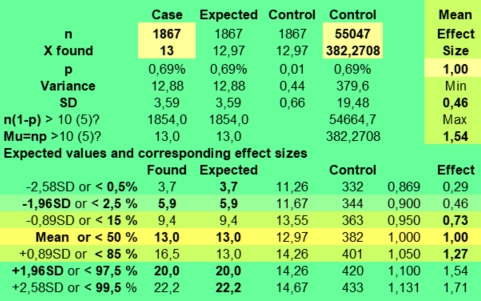 But
the expected values according to the ADB control group as
shown above, do differ much more than the calculator predicted.
Because of the existence of Fast
and slow rising signs, large differences up to a factor 2
could be expected around the 1-7 axis. Moon Gemini in H1 had a very
low expected value of 9,09 in the ADB. This contrasts with Moon in
Gemini in H7 having an expected value of 17,98!
But
the expected values according to the ADB control group as
shown above, do differ much more than the calculator predicted.
Because of the existence of Fast
and slow rising signs, large differences up to a factor 2
could be expected around the 1-7 axis. Moon Gemini in H1 had a very
low expected value of 9,09 in the ADB. This contrasts with Moon in
Gemini in H7 having an expected value of 17,98!
The conclusion is clear. You cannot count on a combined risk of 1/144 when the houses or slow planets ase involved. Large and if possible matched control groups are needed to deal with the peculiarities of the house systems and the slow planets. See: The ADB as a control group.
Confidence intervals should still be estimated to predict the minimal expected deviations around the mean. If you did not take them into account, you would have no idea about the large but not predictive effect sizes that could be randomly produced by the sampling error.
But it should be clearly stated on what assumptions the confidence intervals and other probability calculations were based. As the expected means of houses and slow planets in sign can not be simply estimated by using n divided by 12 as was done in the calculator on the right. More reliable confidence intervals can be estimated by filling in the actual values found values in the large ADB control group in the calculator on the right.
We used in our effect size tables the expected values based on the frequencies found in the ADB. See: Using a control group to evaluate frequencies in 79 art critics. Because ADB categories are just a subset of the ADB control group, the statistical rules involved with the large ADB control group also apply to its categories. So, the argument that we just compared apples with pears does not apply. But of course the ADB is not representative of the whole population. Nevertheless, the ADB is still the best database astrology researchers can rely on. When astrologers stated that they had quite another experience when doing their own research on the categories we studied, we would be very interested in the empirical facts. How did you measure them? What were your considerations? How did you come to your conclusion?
Our message to astrologers doing “my own low-key empirical research” is that looking at the found values without using a control group can be very treacherous. Especially when those astrologers would wrongly assume that chance does not exits and thus habitually would ignore the sampling error.
Let us show these principles again for Venus in sign and house. We dealt with 1867 astrologers and assumed an expected value np of 1867/144 is 13. That would be our reference point. Taking into account the skewness of the binomial distribution we even might expect 12 as the most likely value. Our focus would of course be on the extreme values, as here some astrological effects might be found.
Here many values fall outside the in 95 % (6-20) and even in 99 % of cases (4-22) expected range of the normal distribution. Using the exact binomial distribution approach, the 99 % confidence interval would be from 5 - 23 corresponding to effect sizes of 0,39 - 1,77. The normal distribution does not take into account the skewness and discrete values of the in practice found discrete values. For this reason normal distribution approach could predict negative effect sizes like effect size 0,23, range -0,03 - 0,49 for Venus in Cancer (3 found against 13 expected).
Below we concentrate on the values outside the binomial distribution expected 5-23 range dealing with estimated effect sizes 0,39 - 1,71. On average 1,44 ( 95% range 0 - 4) false positive could be expected, but we actually found many more. So this could be case for astrology or just some maybe obvious bias. The eight out of range values were marked yellow. Astrological effect or bias?
|
|
|
Aries |
Tau |
Gemini |
Cancer |
Leo |
Virgo |
Libra |
Scorp |
Sag |
Cap |
Aqua |
Pisces |
Total |
|
Venus |
H1 |
15 |
12 |
9 |
12 |
19 |
14 |
11 |
20 |
15 |
21 |
23 |
12 |
183 |
|
H2 |
12 |
14 |
9 |
15 |
7 |
14 |
12 |
27 |
15 |
14 |
22 |
21 |
182 |
|
|
H3 |
16 |
8 |
9 |
16 |
5 |
10 |
11 |
24 |
15 |
14 |
18 |
18 |
164 |
|
|
H4 |
11 |
7 |
11 |
8 |
4 |
18 |
7 |
11 |
8 |
14 |
17 |
14 |
130 |
|
|
H5 |
15 |
8 |
5 |
3 |
5 |
13 |
5 |
12 |
15 |
10 |
16 |
9 |
116 |
|
|
H6 |
8 |
7 |
6 |
12 |
5 |
10 |
9 |
11 |
16 |
11 |
12 |
13 |
120 |
|
|
H7 |
9 |
18 |
18 |
14 |
12 |
20 |
13 |
8 |
8 |
14 |
6 |
14 |
154 |
|
|
H8 |
10 |
10 |
12 |
18 |
6 |
9 |
6 |
11 |
8 |
10 |
8 |
8 |
116 |
|
|
H9 |
14 |
19 |
13 |
12 |
16 |
21 |
7 |
14 |
14 |
7 |
20 |
9 |
166 |
|
|
H10 |
12 |
29 |
8 |
19 |
9 |
15 |
13 |
15 |
11 |
8 |
16 |
14 |
169 |
|
|
H11 |
25 |
19 |
25 |
31 |
9 |
21 |
8 |
7 |
14 |
8 |
17 |
13 |
197 |
|
|
H12 |
17 |
9 |
19 |
22 |
11 |
17 |
16 |
12 |
7 |
14 |
12 |
14 |
170 |
|
|
Total |
164 |
160 |
144 |
182 |
108 |
182 |
118 |
172 |
146 |
145 |
187 |
159 |
1867 |
|
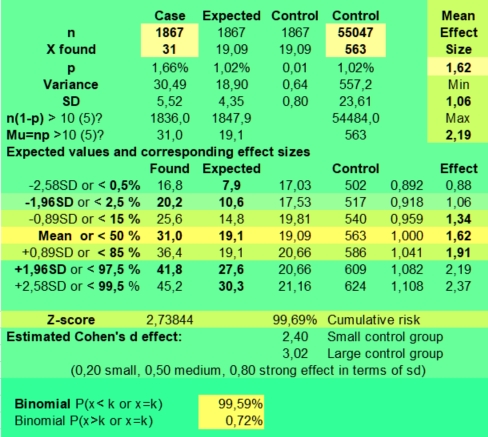 The
lowest score is for Venus in Cancer and H5 being found 3 times
against 13 times expected when using p is 1/12 (effect size 0,23, 0 -
0,49). In the control group 330 out of 55047 cases (11,2 expected)
were found resulting in a similar effect size (0,27, range 0 - 0,57).
P(x=3 or x<3) was a significant 0,42 %. If we found many more of
them (preferably >4), astrologers could start a party!
The
lowest score is for Venus in Cancer and H5 being found 3 times
against 13 times expected when using p is 1/12 (effect size 0,23, 0 -
0,49). In the control group 330 out of 55047 cases (11,2 expected)
were found resulting in a similar effect size (0,27, range 0 - 0,57).
P(x=3 or x<3) was a significant 0,42 %. If we found many more of
them (preferably >4), astrologers could start a party!
Venus in Leo and H4 was found 4 times having an effect size 0,31 (0,01 - 0,61). In the control group 269 cases were found resulting in an effect size (0,44, range 0.01 - 0,87). P(x=4 or x<4) was a not significant 5,05 %
A high score is found for Venus in Cancer and H11, 31 times against 13 expected, having an effect size of 2,39 (95 % range 1,56 - 3,23). Getting a value of 31 or higher was only expected in 0,02 % of cases using the binomial if p = 1/144. But in the control group 563 out of 55047 cases (19,1 expected) were found resulting in a smaller effect size (1,62, range 1,06 - 2,19) with P(x>30) being 0,72 %.
As you can see in the picture on the right under Expected values and corresponding effect sizes, based on the findings in the control group (563 found out of 55047 ), the in 95 % of normally distributed expected range of values was 10,6 - 27,6 and the 99 % expected range of values were 7,9 - 30,3.
The value of 31 is significantly higher than expected by the 95 % confidence interval (27,6), but getting 31 against at most 30,3 expected hints to borderline case with regards to the 99 % confidence interval. Here the binomial calculator can predict much better.
When filling in n =1847 and p = +563/55047 in the binomial calculator, the risk involved of getting P(k>30) is 0,72 %, which is not significant with an alpha of 1 % in a two-sided test.
The other high score is 29 for Venus in Taurus and H10, having a 2,24 (1,43 - 3,04) effect size, having a binomial risk of being found just by chance ( Px>k-1) of 0,01 % at most. So we deal with extremely unlikely values, being bias or effect.
But the control group had 521 cases of them, so 17,67 and not 13 of them were expected decreasing the effect size to 1,64 (1,05 - 2,23). With a Z score of 3,26 it is still a significant difference, but the predictive value would be modest. And P(x > 28) is 0,79 % in the binomial, which is not yet significant at the 99 % confidence level.
It is clear that ALWAYS using the expected values and effect sizes based on the ADB would be more realistic. Otherwise you did not really understand the fallacies involved with astrology. But who can keep this huge background view of astrological reality without distortions in mind? Actually only computers can do this work. But humans still have to interpret the tables.
Do we still see effect sizes of 0,39 - 1,77 or larger in it? Some. We labelled the highest and lowest found values per sign yellow and the maybe at the 99 % significant effect sizes red. Two were found of them, against 1,44 times expected.
|
|
|
Aries |
Taurus |
Gemini |
Cancer |
Leo |
Virgo |
Libra |
Scorp |
Sag |
Cap |
|
Pisces |
Total |
|
|
H1 |
0,95 |
1,02 |
0,90 |
1,04 |
1,62 |
0,88 |
0,78 |
1,22 |
0,90 |
1,44 |
1,19 |
0,75 |
12,69 |
|
|
H2 |
0,92 |
1,16 |
0,87 |
1,35 |
0,68 |
0,96 |
0,94 |
1,64 |
0,85 |
0,89 |
1,19 |
1,50 |
12,95 |
|
Effect |
H3 |
1,31 |
0,70 |
1,02 |
1,38 |
0,54 |
0,66 |
0,93 |
1,53 |
0,91 |
0,98 |
0,98 |
1,42 |
12,35 |
|
size |
H4 |
0,91 |
0,64 |
1,14 |
0,81 |
0,44 |
1,35 |
0,63 |
0,80 |
0,57 |
1,07 |
1,04 |
1,20 |
10,60 |
|
of |
H5 |
1,24 |
0,75 |
0,56 |
0,27 |
0,61 |
1,03 |
0,49 |
0,86 |
1,07 |
0,81 |
1,01 |
0,70 |
9,38 |
|
Venus |
H6 |
0,70 |
0,68 |
0,83 |
1,23 |
0,56 |
0,85 |
0,83 |
0,84 |
1,08 |
0,90 |
0,87 |
1,02 |
10,40 |
|
in |
H7 |
0,68 |
1,30 |
1,23 |
0,91 |
0,99 |
1,49 |
1,34 |
0,83 |
0,88 |
2,02 |
0,58 |
1,41 |
13,66 |
|
House |
H8 |
0,74 |
0,76 |
0,84 |
1,15 |
0,50 |
0,65 |
0,66 |
1,12 |
0,90 |
1,26 |
0,70 |
0,73 |
10,01 |
|
and |
H9 |
1,03 |
1,18 |
0,79 |
0,73 |
1,27 |
1,35 |
0,76 |
1,26 |
1,47 |
0,89 |
1,67 |
0,82 |
13,23 |
|
sign |
H10 |
0,79 |
1,64 |
0,48 |
0,95 |
0,63 |
0,92 |
1,30 |
1,30 |
1,28 |
0,94 |
1,28 |
1,13 |
12,63 |
|
|
H11 |
1,44 |
1,15 |
1,29 |
1,62 |
0,59 |
1,20 |
0,74 |
0,61 |
1,37 |
0,89 |
1,28 |
1,01 |
13,19 |
|
|
H12 |
1,00 |
0,50 |
1,07 |
0,98 |
0,72 |
0,96 |
1,33 |
0,99 |
0,68 |
1,50 |
0,92 |
1,19 |
11,83 |
|
Total |
|
11,73 |
11,49 |
11,01 |
12,42 |
9,15 |
12,29 |
10,73 |
12,98 |
11,95 |
13,59 |
12,72 |
12,88 |
142,93 |
The score of 14 for Venus in Capricorn in H7 is interesting. When assuming an expected values of 13 with probability 1/144, it should have a not relevant effect size of 1,08 (0,52-1,64). But within the ADB control group Venus in Capricorn in H7 had the lowest score of 204. Thus the actual effect size was 2,02 (0,97- 3,08) with a P(x=14 or x>14) of 1,16 %.
Below you see the binomial probabilities involved with the effect sizes. The negative values refer to P(x<=k) with effect size < 1 and the positive values to P(x>k) with an effect size >1. The lowest and possibly significant is given. Significant values below 2,5% are marked yellow. Five of them are found against 144/20 is 7,2 expected. One value was below 0,5% (1,44 expected).
|
|
|
Aries |
Tau |
Gemini |
Cancer |
Leo |
Virgo |
Libra |
Scorp |
Sag |
Cap |
|
Pisces |
Total |
|
Venus |
H1 |
-48,93 |
51,20 |
-46,12 |
48,41 |
3,06 |
-37,87 |
-24,44 |
21,96 |
-39,96 |
6,48 |
22,41 |
-19,14 |
-62,93 |
|
H2 |
-46,01 |
32,60 |
-41,11 |
15,20 |
-19,84 |
-50,85 |
-49,41 |
1,03 |
-30,66 |
-38,51 |
22,94 |
4,75 |
-199,87 |
|
|
H3 |
16,79 |
-20,06 |
52,50 |
12,52 |
-10,40 |
-10,68 |
-47,61 |
3,08 |
-41,25 |
-54,08 |
-52,31 |
9,23 |
-142,28 |
|
|
H4 |
-45,66 |
-15,22 |
37,52 |
-34,32 |
-5,05 |
12,98 |
-13,88 |
-28,51 |
-5,81 |
43,71 |
46,53 |
28,69 |
20,98 |
|
|
H5 |
23,42 |
-25,73 |
-12,00 |
-0,42 |
-16,95 |
49,83 |
-6,03 |
-36,03 |
43,04 |
-30,46 |
52,10 |
-17,24 |
23,52 |
|
|
H6 |
-20,06 |
-19,28 |
-42,14 |
27,68 |
-12,00 |
-36,76 |
-36,37 |
-33,98 |
41,70 |
-43,36 |
-38,42 |
50,59 |
-162,39 |
|
|
H7 |
-14,63 |
16,30 |
22,16 |
-42,49 |
55,50 |
5,49 |
17,74 |
-37,11 |
-44,36 |
1,16 |
-10,92 |
12,80 |
-18,36 |
|
|
H8 |
-20,78 |
-24,30 |
-32,44 |
31,27 |
-4,43 |
-11,81 |
-19,81 |
39,64 |
-47,05 |
27,52 |
-19,26 |
-24,14 |
-105,57 |
|
|
H9 |
48,55 |
26,05 |
-23,58 |
-16,19 |
20,01 |
10,97 |
-29,38 |
22,66 |
10,11 |
-46,64 |
2,05 |
-34,85 |
-10,24 |
|
|
H10 |
-24,54 |
0,79 |
-1,50 |
-47,19 |
-9,31 |
-44,20 |
20,84 |
18,95 |
24,91 |
-52,12 |
19,45 |
35,52 |
-58,39 |
|
|
H11 |
4,79 |
29,83 |
12,26 |
0,72 |
-6,01 |
22,97 |
-24,45 |
-11,13 |
15,33 |
-46,14 |
18,31 |
52,87 |
69,34 |
|
|
H12 |
53,19 |
-1,41 |
41,63 |
-52,07 |
-16,48 |
-49,30 |
16,03 |
55,50 |
-19,56 |
9,10 |
-46,38 |
29,74 |
20,00 |
|
|
Total |
-73,86 |
50,78 |
-32,83 |
-56,87 |
-21,90 |
-139,22 |
-196,76 |
16,06 |
-93,56 |
-223,34 |
16,49 |
128,83 |
-626,19 |
|
Conclusion: we do not see a case for astrology as the found variation including the significant ones are within the by the NULL hypothesis expected range. Only Venus in Cancer and H5 was statistically with an alpha of 0,01. But the value is not that many standard deviations away from the mean to be seen as unexpected finding in a table of 144 items. Only if we saw many of them, we had a case for astrology.
Should we start a new thread on some astrology forum with the question why astrologers have twice more often Venus in Capricorn and H7 than expected? Or why astrologers have 3 times less likely Venus in Cancer and in the 5th house?
Do we see effect sizes of 0,39 - 1,77 or larger in for Mercury in sign and House?
|
|
|
Aries |
Tau |
Gemini |
Cancer |
Leo |
Virgo |
Libra |
Scorp |
Sag |
Cap |
|
Pisces |
Total |
|
Mercury |
H1 |
0,93 |
1,56 |
1,33 |
0,87 |
1,27 |
1,13 |
1,18 |
0,82 |
0,68 |
1,56 |
0,63 |
1,50 |
13,47 |
|
in |
H2 |
0,71 |
0,75 |
0,64 |
0,44 |
1,03 |
1,10 |
0,72 |
1,10 |
1,13 |
0,95 |
1,12 |
1,45 |
11,12 |
|
|
H3 |
0,63 |
0,43 |
1,25 |
0,77 |
0,92 |
0,83 |
0,83 |
1,17 |
1,26 |
1,20 |
1,37 |
1,06 |
11,72 |
|
|
H4 |
1,00 |
1,21 |
0,83 |
0,93 |
0,47 |
0,73 |
0,75 |
0,82 |
1,30 |
1,32 |
0,74 |
1,29 |
11,39 |
|
|
H5 |
1,25 |
0,66 |
1,12 |
0,66 |
0,80 |
0,94 |
0,83 |
1,12 |
0,55 |
1,24 |
0,65 |
0,76 |
10,58 |
|
|
H6 |
0,85 |
1,13 |
1,15 |
0,74 |
0,51 |
0,85 |
0,82 |
0,92 |
0,92 |
1,05 |
0,27 |
0,48 |
9,70 |
|
|
H7 |
1,03 |
0,32 |
1,13 |
0,70 |
0,81 |
0,57 |
1,39 |
0,76 |
1,10 |
0,76 |
0,57 |
0,93 |
10,07 |
|
|
H8 |
0,72 |
0,81 |
0,79 |
1,07 |
1,11 |
0,88 |
1,53 |
1,69 |
0,79 |
1,59 |
1,03 |
0,80 |
12,81 |
|
|
H9 |
1,63 |
0,77 |
0,68 |
1,08 |
1,51 |
1,07 |
0,97 |
1,36 |
1,14 |
1,12 |
1,62 |
1,15 |
14,10 |
|
|
H10 |
0,94 |
1,22 |
1,23 |
0,62 |
0,73 |
1,43 |
0,95 |
1,09 |
0,95 |
1,10 |
0,93 |
1,21 |
12,40 |
|
|
H11 |
0,88 |
1,07 |
1,09 |
1,14 |
0,72 |
0,78 |
1,21 |
1,07 |
1,17 |
1,04 |
1,72 |
1,19 |
13,07 |
|
|
H12 |
0,39 |
1,26 |
1,10 |
1,33 |
1,04 |
0,93 |
1,20 |
0,68 |
1,34 |
0,78 |
1,30 |
0,93 |
12,27 |
|
Total |
|
10,96 |
11,19 |
12,35 |
10,37 |
10,92 |
11,24 |
12,37 |
12,59 |
12,33 |
13,70 |
11,94 |
12,74 |
142,71 |
Mercury in Aquarius in H6 had 4 astrologers and 435 were found in the ADB. The effect size is 0,27 (0,01 - 0,54) with a risk of P (x<5) of 0,10 %.
Mercury in Aries in H12 had 6 astrologers and 453 were found in the ADB. The effect size is 0,39 (0,08 - 0,70) with a risk of P (x<7) of 0,59 %.
Mercury in Taurus in H7 had 4 astrologers and 371 were found in the ADB. The effect size is 0,39 (0,08 - 0,70) with a risk of P (x<5) of 0,49 %.
Mercury in Aquarius in H11 had 22 astrologers and 377 were found in the ADB. The effect size is 1,72 (1,01 - 2,44) with a risk of P (x>21) of 1,16 %.
Do we see effect sizes of 0,39 - 1,77 or larger in for Mars in sign and House?
|
|
|
Aries |
Tau |
Gemini |
Cancer |
Leo |
Virgo |
Libra |
Scorp |
Sag |
Cap |
|
Pisces |
Total |
|
Mars |
H1 |
0,72 |
1,11 |
0,63 |
0,94 |
1,14 |
0,82 |
1,16 |
0,68 |
1,42 |
1,07 |
0,56 |
1,08 |
11,34 |
|
in |
H2 |
0,49 |
0,86 |
1,28 |
0,99 |
1,13 |
0,97 |
1,28 |
0,96 |
1,44 |
1,34 |
0,41 |
1,29 |
12,43 |
|
|
H3 |
0,75 |
1,24 |
0,86 |
1,15 |
0,76 |
0,78 |
0,84 |
0,90 |
1,12 |
0,99 |
0,71 |
1,16 |
11,25 |
|
|
H4 |
1,55 |
0,93 |
1,04 |
1,27 |
1,21 |
0,86 |
0,92 |
0,73 |
1,38 |
0,89 |
1,08 |
0,81 |
12,65 |
|
|
H5 |
1,15 |
1,21 |
1,11 |
1,09 |
1,14 |
1,27 |
0,45 |
1,32 |
0,56 |
0,87 |
0,46 |
1,24 |
11,86 |
|
|
H6 |
0,71 |
0,94 |
1,24 |
1,05 |
0,99 |
0,82 |
0,55 |
1,06 |
0,75 |
1,69 |
1,04 |
0,93 |
11,76 |
|
|
H7 |
1,12 |
0,98 |
0,78 |
0,66 |
1,40 |
1,14 |
0,86 |
1,09 |
1,24 |
0,52 |
0,88 |
0,80 |
11,46 |
|
|
H8 |
0,93 |
0,80 |
1,38 |
0,93 |
0,73 |
1,04 |
1,22 |
1,32 |
0,80 |
0,70 |
1,18 |
1,22 |
12,24 |
|
|
H9 |
0,92 |
0,86 |
1,02 |
0,94 |
0,55 |
1,13 |
1,23 |
0,86 |
1,50 |
0,37 |
1,81 |
1,16 |
12,38 |
|
|
H10 |
1,17 |
0,86 |
0,98 |
1,01 |
0,95 |
0,81 |
0,83 |
1,10 |
0,79 |
0,99 |
0,79 |
1,18 |
11,47 |
|
|
H11 |
1,42 |
1,35 |
1,11 |
1,04 |
0,57 |
1,12 |
1,21 |
0,82 |
0,76 |
0,90 |
1,57 |
0,99 |
12,85 |
|
|
H12 |
1,09 |
0,78 |
1,09 |
1,00 |
1,39 |
0,67 |
0,99 |
1,08 |
1,44 |
0,87 |
1,08 |
1,29 |
12,79 |
|
Total |
|
12,03 |
11,93 |
12,53 |
12,06 |
11,93 |
11,43 |
11,54 |
11,91 |
13,20 |
11,19 |
11,56 |
13,16 |
144,49 |
Mars in Capricorn in H9 had 3 astrologers and 237 were found in the ADB. The effect size is 0,37 (0 - 0,80) with a risk of P (x<4) of 4,10 %.
Mars in Aquarius in H9 had 15 astrologers and 244 were found in the ADB. The effect size is 1,81 (0,90 - 2,73) with a risk of P (x>15) of 2,22 %.
Do we see effect sizes of 0,39 - 1,77 or larger in for Jupiter in sign and House? No. Effect sizes range from 0,40 to 1,56.
|
|
|
Aries |
Tau |
Gemini |
Cancer |
Leo |
Virgo |
Libra |
Scorp |
Sag |
Cap |
|
Pisces |
Total |
|
Jupiter |
H1 |
1,10 |
1,20 |
0,48 |
1,06 |
0,79 |
0,85 |
0,80 |
1,56 |
0,87 |
1,30 |
1,39 |
0,78 |
12,17 |
|
in |
H2 |
0,52 |
1,28 |
0,87 |
0,80 |
1,10 |
0,80 |
0,79 |
1,09 |
1,08 |
0,78 |
1,08 |
1,27 |
11,46 |
|
|
H3 |
1,48 |
0,90 |
0,91 |
0,99 |
0,80 |
1,47 |
0,75 |
0,77 |
1,17 |
0,80 |
1,06 |
0,85 |
11,97 |
|
|
H4 |
0,70 |
1,18 |
0,94 |
0,79 |
0,99 |
0,75 |
1,33 |
0,69 |
1,45 |
0,73 |
1,73 |
1,04 |
12,31 |
|
|
H5 |
1,11 |
1,06 |
0,93 |
1,06 |
0,82 |
0,77 |
1,01 |
1,25 |
0,82 |
0,71 |
0,88 |
1,05 |
11,47 |
|
|
H6 |
1,03 |
1,40 |
0,86 |
0,89 |
1,19 |
1,06 |
1,02 |
0,81 |
0,63 |
1,20 |
1,54 |
1,04 |
12,66 |
|
|
H7 |
0,57 |
0,40 |
1,21 |
1,03 |
0,98 |
0,91 |
1,35 |
0,88 |
1,23 |
0,64 |
0,91 |
1,49 |
11,61 |
|
|
H8 |
0,80 |
0,85 |
0,87 |
0,55 |
1,25 |
0,99 |
1,01 |
1,32 |
0,80 |
1,30 |
1,18 |
0,97 |
11,89 |
|
|
H9 |
0,65 |
0,98 |
0,93 |
0,60 |
1,23 |
0,92 |
0,75 |
0,74 |
1,27 |
1,03 |
1,70 |
0,93 |
11,72 |
|
|
H10 |
0,78 |
1,51 |
1,37 |
1,13 |
0,94 |
0,66 |
0,71 |
0,79 |
1,35 |
1,52 |
0,76 |
1,15 |
12,68 |
|
|
H11 |
0,94 |
1,03 |
1,00 |
0,90 |
0,89 |
0,99 |
1,40 |
1,32 |
0,56 |
1,36 |
1,31 |
1,05 |
12,76 |
|
|
H12 |
0,89 |
1,37 |
0,91 |
1,00 |
0,87 |
0,75 |
0,84 |
1,11 |
1,39 |
1,09 |
1,35 |
0,86 |
12,44 |
|
Total |
|
10,56 |
13,16 |
11,26 |
10,83 |
11,85 |
10,92 |
11,76 |
12,33 |
12,62 |
12,46 |
14,89 |
12,48 |
145,13 |
Jupiter in Scorpio in H1 had 26 astrologers and 492 were found in the ADB. The effect size is 1,56 (0,96 - 2,15) with a risk of P (x>25) of 2,03 %.
Jupiter in Taurus in H7 had 6 astrologers and 439 were found in the ADB. The effect size is 0,40 (0,08 - 0,72) with a risk of P (x<7) of 0,80 %.
Do we see effect sizes of 0,39 - 1,77 or larger in for Saturn in sign and House?
|
|
|
Aries |
Tau |
Gemini |
Cancer |
Leo |
Virgo |
Libra |
Scorp |
Sag |
Cap |
|
Pisces |
Total |
|
Saturn |
H1 |
1,19 |
0,92 |
1,22 |
0,82 |
1,31 |
1,31 |
1,07 |
0,71 |
1,14 |
0,68 |
0,77 |
0,72 |
11,85 |
|
in |
H2 |
0,57 |
0,83 |
0,34 |
0,49 |
0,44 |
1,20 |
0,96 |
1,38 |
1,29 |
0,80 |
1,02 |
0,66 |
9,99 |
|
|
H3 |
1,34 |
0,74 |
1,04 |
1,47 |
0,78 |
1,04 |
1,25 |
1,01 |
1,17 |
1,02 |
1,06 |
0,66 |
12,57 |
|
|
H4 |
0,80 |
0,94 |
1,54 |
0,79 |
0,97 |
1,56 |
0,71 |
0,91 |
0,72 |
1,05 |
0,63 |
0,79 |
11,41 |
|
|
H5 |
0,91 |
1,06 |
0,87 |
1,55 |
1,01 |
1,07 |
0,71 |
0,99 |
0,83 |
0,49 |
0,60 |
0,58 |
10,67 |
|
|
H6 |
1,45 |
1,09 |
1,35 |
0,81 |
1,57 |
0,89 |
1,06 |
1,05 |
1,19 |
1,14 |
0,95 |
0,61 |
13,17 |
|
|
H7 |
0,73 |
0,68 |
0,88 |
1,11 |
1,37 |
1,38 |
1,16 |
0,88 |
0,85 |
0,57 |
0,81 |
0,65 |
11,09 |
|
|
H8 |
0,80 |
0,78 |
0,68 |
1,34 |
1,45 |
0,74 |
1,18 |
1,12 |
0,48 |
1,19 |
0,88 |
1,52 |
12,16 |
|
|
H9 |
0,63 |
0,91 |
0,56 |
1,62 |
1,10 |
1,18 |
1,10 |
1,54 |
1,03 |
0,96 |
1,49 |
1,35 |
13,48 |
|
|
H10 |
1,38 |
1,01 |
1,03 |
0,53 |
1,20 |
0,94 |
0,82 |
1,29 |
1,14 |
1,52 |
0,93 |
1,17 |
12,96 |
|
|
H11 |
1,20 |
0,95 |
1,00 |
1,04 |
0,96 |
1,09 |
1,01 |
1,37 |
1,12 |
1,06 |
1,29 |
0,55 |
12,64 |
|
|
H12 |
0,68 |
1,43 |
1,07 |
1,19 |
1,12 |
0,67 |
1,88 |
1,28 |
0,92 |
0,57 |
1,13 |
0,81 |
12,75 |
|
Total |
|
11,68 |
11,35 |
11,58 |
12,77 |
13,29 |
13,06 |
12,91 |
13,51 |
11,89 |
11,06 |
11,57 |
10,06 |
144,74 |
Saturn in Gemini in H2 had 3 astrologers and 258 were found in the ADB. The effect size is 0,34 (0 - 0,73) with a risk of P (x<4) of 2,51 %.
Saturn in Libra in H12 had 24 astrologers and 376 were found in the ADB. The effect size is 1,88 (1,13 - 2,63) with a risk of P (x>15) of 0,30 %.
Do we see effect sizes of 0,39 - 1,77 or larger in for Uranus in sign and House? Only two low values. The highest found value was 1,64.
|
|
|
Aries |
Tau |
Gemini |
Cancer |
Leo |
Virgo |
Libra |
Scorp |
Sag |
Cap |
|
Pisces |
Total |
|
Uranus |
H1 |
1,14 |
1,31 |
1,20 |
1,43 |
1,32 |
0,95 |
0,77 |
0,72 |
0,89 |
0,77 |
1,33 |
1,16 |
12,99 |
|
in |
H2 |
0,68 |
1,08 |
1,27 |
1,01 |
1,15 |
0,87 |
0,92 |
1,64 |
0,73 |
0,83 |
0,80 |
0,83 |
11,81 |
|
|
H3 |
0,59 |
0,82 |
1,21 |
1,34 |
1,08 |
0,73 |
0,63 |
1,46 |
0,95 |
1,19 |
0,84 |
0,83 |
11,66 |
|
|
H4 |
0,71 |
0,78 |
1,21 |
1,49 |
0,75 |
0,68 |
0,82 |
0,82 |
1,20 |
0,85 |
0,93 |
1,12 |
11,35 |
|
|
H5 |
1,19 |
0,67 |
1,40 |
1,72 |
0,88 |
0,72 |
0,62 |
1,29 |
0,81 |
0,47 |
0,73 |
1,26 |
11,75 |
|
|
H6 |
0,65 |
1,37 |
1,29 |
0,95 |
1,24 |
0,48 |
0,38 |
0,43 |
1,31 |
0,72 |
0,94 |
0,73 |
10,48 |
|
|
H7 |
0,68 |
0,65 |
1,46 |
1,62 |
0,99 |
0,68 |
0,76 |
1,13 |
0,62 |
1,50 |
1,55 |
0,78 |
12,40 |
|
|
H8 |
0,45 |
0,91 |
1,64 |
1,26 |
0,91 |
1,30 |
0,83 |
0,73 |
0,51 |
0,86 |
1,16 |
0,71 |
11,26 |
|
|
H9 |
0,85 |
0,89 |
0,88 |
1,25 |
0,94 |
0,97 |
0,64 |
0,83 |
1,12 |
0,95 |
0,70 |
0,89 |
10,90 |
|
|
H10 |
0,99 |
1,03 |
1,11 |
1,53 |
1,28 |
1,20 |
1,46 |
1,06 |
1,71 |
1,00 |
1,18 |
0,60 |
14,14 |
|
|
H11 |
1,09 |
1,29 |
1,64 |
1,31 |
0,60 |
0,69 |
0,63 |
1,27 |
0,87 |
0,87 |
1,30 |
1,32 |
12,88 |
|
|
H12 |
0,88 |
1,54 |
0,93 |
1,00 |
0,94 |
0,65 |
0,40 |
0,88 |
1,21 |
0,38 |
1,47 |
0,63 |
10,91 |
|
Total |
|
9,90 |
12,34 |
15,23 |
15,89 |
12,09 |
9,92 |
8,84 |
12,24 |
11,94 |
10,37 |
12,93 |
10,85 |
142,54 |
Uranus in Libra in H6 had 5 astrologers and 391 were found in the ADB. The effect size is 0,38 (0,05 - 0,71) with a risk of P (x<6) of 0,89 %.
Uranus in Capricorn in H12 had 3 astrologers and 231 were found in the ADB. The effect size is 0,38 (0 - 0,82) with a risk of P (x<4) of 4,70 %.
Uranus in Scorpio in H2 had 22 astrologers and 395 were found in the ADB. The effect size is 1,64 (0,99 - 2,32) with a risk of P (x>21) of 1,86 %.
Uranus in Gemini in H8 had 33 astrologers and 594 were found in the ADB. The effect size is 1,64 (1,08 - 2,19 with a risk of P (x>32) of 0,50 %.
Uranus in Gemini in H11 had 38 astrologers and 683 were found in the ADB. The effect size is 1,64 (1,12 - 2,16) with a risk of P (x>37) of 0,27 %.
Do we see effect sizes of 0,39 - 1,77 or larger in for Neptune in sign and House? Many, but working with slow planets like Neptune is like throwing a dice only a few times. Before starting to calculate the individual risks involved with them, it is better to look first at the big picture, as the row and column Totals have unusual pattern.
|
|
|
Aries |
Tau |
Gemini |
Cancer |
Leo |
Virgo |
Libra |
Scorp |
Sag |
Cap |
|
Pisces |
Total |
|
Neptune |
H1 |
0,47 |
0,63 |
1,20 |
2,06 |
1,00 |
0,83 |
1,03 |
0,74 |
0,14 |
0,00 |
0,36 |
0,50 |
8,97 |
|
in |
H2 |
1,12 |
0,78 |
2,06 |
1,53 |
0,84 |
1,08 |
1,61 |
0,51 |
0,06 |
0,21 |
0,21 |
0,92 |
10,94 |
|
|
H3 |
0,95 |
1,81 |
1,72 |
1,32 |
1,05 |
1,24 |
1,48 |
0,79 |
0,00 |
0,12 |
0,00 |
0,63 |
11,10 |
|
|
H4 |
0,20 |
1,35 |
1,64 |
1,44 |
1,37 |
1,36 |
1,17 |
0,99 |
0,25 |
0,00 |
0,00 |
0,49 |
10,25 |
|
|
H5 |
0,63 |
1,59 |
2,01 |
1,57 |
0,90 |
1,32 |
1,17 |
1,00 |
0,36 |
0,10 |
0,23 |
0,23 |
11,11 |
|
|
H6 |
0,65 |
1,93 |
1,44 |
1,02 |
1,13 |
1,06 |
1,27 |
0,51 |
0,19 |
0,11 |
0,00 |
0,66 |
9,97 |
|
|
H7 |
0,84 |
1,77 |
2,21 |
1,55 |
1,23 |
0,92 |
1,58 |
1,00 |
0,00 |
0,00 |
0,29 |
0,00 |
11,40 |
|
|
H8 |
0,67 |
0,76 |
1,29 |
1,04 |
0,93 |
0,69 |
1,46 |
1,20 |
0,10 |
0,00 |
0,00 |
0,27 |
8,41 |
|
|
H9 |
1,11 |
1,39 |
2,79 |
1,31 |
0,96 |
1,13 |
1,42 |
0,51 |
0,00 |
0,15 |
0,27 |
1,39 |
12,41 |
|
|
H10 |
0,70 |
1,21 |
2,14 |
1,35 |
1,54 |
1,12 |
1,71 |
0,82 |
0,10 |
0,00 |
0,00 |
0,57 |
11,25 |
|
|
H11 |
1,50 |
0,93 |
1,63 |
1,00 |
0,82 |
0,59 |
1,47 |
0,41 |
0,21 |
0,00 |
0,00 |
0,29 |
8,86 |
|
|
H12 |
0,57 |
0,40 |
2,08 |
1,45 |
1,03 |
0,80 |
1,43 |
1,33 |
0,34 |
0,00 |
0,00 |
1,59 |
11,03 |
|
Total |
|
9,40 |
14,56 |
22,21 |
16,64 |
12,79 |
12,14 |
16,80 |
9,80 |
1,75 |
0,70 |
1,37 |
7,55 |
125,71 |
Normally, the found row and column totals would be a normally distributed values around the expected mean of 12, as we dealt with 12 planets and 12 houses. When studying the personal planets we did not stress them, as they seemed to be close to 12. But here we see a high total values for Neptune in Gemini (22,21) and low effect sizes for Neptune in Sagittarius (1,75). And the score of Neptune in Cancer (16,64) is much higher than that of Neptune in Capricorn (0,70).
If we compare Neptune found in the ADB category astrologers with the ADB as a whole (expected), we see a peak for Neptune in Libra most recently dealing with people born in certain periods between October 1942 and August 1957.
|
Neptune |
|
Aries |
Tau |
Gemini |
Cancer |
Leo |
Virgo |
Libra |
Scorp |
Sag |
Cap |
|
Pisces |
Total |
|
Astrologers |
50 |
119 |
232 |
238 |
265 |
280 |
440 |
178 |
23 |
6 |
6 |
30 |
1867 |
|
|
Expected |
63 |
100 |
122 |
175 |
248 |
279 |
316 |
221 |
152 |
91 |
51 |
48 |
1867,00 |
|
In the sixties (Neptune in scorpio) and certainly in the seventies (Neptune in sagittarius) and eighties (Neptune in Sagittarius and Capricorn) of the twentieth century we see a decline in the number of astrologers born, reflecting a historical trend that does not need to be astrologically explained.
Do we see effect sizes outside the normally expected range of 0,39 - 1,77 for Pluto in sign and House? Yes, many.
|
|
|
Aries |
Tau |
Gemini |
Cancer |
Leo |
Virgo |
Libra |
Scorp |
Sag |
Cap |
Aqua |
Pisces |
Total |
|
Pluto |
H1 |
0,56 |
0,83 |
1,44 |
1,02 |
1,40 |
0,88 |
0,00 |
0,00 |
0,00 |
0,58 |
0,67 |
0,00 |
7,38 |
|
in |
H2 |
0,39 |
0,77 |
1,27 |
1,31 |
1,14 |
0,78 |
0,42 |
0,00 |
0,00 |
1,55 |
0,98 |
0,32 |
8,94 |
|
|
H3 |
0,00 |
1,07 |
1,80 |
1,32 |
1,17 |
0,80 |
0,10 |
0,00 |
0,00 |
0,00 |
0,00 |
0,67 |
6,93 |
|
|
H4 |
0,42 |
1,08 |
1,67 |
0,99 |
1,25 |
0,77 |
0,29 |
0,15 |
0,00 |
0,69 |
0,00 |
0,32 |
7,64 |
|
|
H5 |
0,22 |
0,92 |
1,64 |
1,25 |
1,34 |
0,87 |
0,10 |
0,00 |
0,00 |
0,00 |
0,00 |
0,00 |
6,35 |
|
|
H6 |
0,22 |
0,87 |
1,64 |
1,07 |
1,33 |
0,84 |
0,10 |
0,00 |
0,36 |
0,00 |
1,84 |
0,78 |
9,06 |
|
|
H7 |
0,00 |
1,21 |
1,67 |
0,86 |
1,27 |
0,77 |
0,00 |
0,22 |
0,00 |
0,00 |
0,00 |
0,61 |
6,62 |
|
|
H8 |
0,36 |
0,79 |
1,56 |
1,04 |
1,49 |
0,72 |
0,25 |
0,21 |
0,00 |
0,00 |
0,00 |
0,00 |
6,41 |
|
|
H9 |
0,16 |
0,70 |
1,63 |
1,25 |
1,60 |
0,61 |
0,12 |
0,00 |
0,00 |
0,00 |
0,00 |
0,00 |
6,07 |
|
|
H10 |
0,53 |
1,19 |
1,55 |
0,87 |
1,06 |
0,95 |
0,12 |
0,00 |
0,00 |
0,00 |
1,84 |
0,32 |
8,44 |
|
|
H11 |
0,32 |
0,96 |
1,40 |
0,74 |
1,44 |
0,61 |
0,00 |
0,00 |
0,00 |
0,00 |
0,00 |
0,00 |
5,48 |
|
|
H12 |
0,34 |
0,90 |
1,80 |
1,09 |
1,36 |
0,43 |
0,00 |
0,00 |
0,00 |
0,00 |
0,00 |
0,32 |
6,25 |
|
Total |
|
3,51 |
11,31 |
19,07 |
12,83 |
15,86 |
9,03 |
1,50 |
0,58 |
0,36 |
2,82 |
5,34 |
3,36 |
85,56 |
When looking at the Pluto found and expected under astrologers, we see the same strong decline of astrologers being born in the seventies and eighties, which started with people born under Pluto in Virgo (around the sixties).
|
Pluto in |
Aries |
Tau |
Gemini |
Cancer |
Leo |
Virgo |
Libra |
Scorp |
Sag |
Cap |
Aqua |
Pisces |
|
|
Astrologers |
19 |
144 |
488 |
472 |
548 |
158 |
14 |
3 |
1 |
4 |
5 |
11 |
1867 |
|
Expected |
63 |
152 |
306 |
452 |
413 |
211 |
111 |
66 |
26 |
16 |
12 |
39 |
1867 |
And of course the birth year as such is not responsible for the decline af astrology, but the empirical research being done on astrological matters that did not encourage young people to chose for a career in astrology. And this also coincidences with the enduring process of secularism in the Western world.
Do we see effect sizes of 0,39 - 1,77 or larger in for North Node in sign and House?
|
|
|
Aries |
Tau |
Gemini |
Cancer |
Leo |
Virgo |
Libra |
Scorp |
Sag |
Cap |
|
Pisces |
Total |
|
North |
H1 |
1,40 |
1,23 |
0,80 |
0,79 |
0,92 |
1,19 |
0,91 |
1,38 |
1,42 |
1,15 |
0,96 |
1,19 |
13,34 |
|
Node |
H2 |
1,79 |
1,38 |
0,80 |
1,27 |
0,68 |
1,01 |
0,63 |
0,67 |
0,55 |
0,81 |
0,84 |
0,93 |
11,37 |
|
in |
H3 |
1,00 |
0,67 |
1,20 |
1,07 |
1,56 |
1,29 |
0,94 |
0,51 |
1,20 |
1,23 |
0,94 |
1,66 |
13,29 |
|
|
H4 |
0,98 |
1,05 |
1,17 |
1,24 |
1,03 |
0,72 |
1,29 |
0,93 |
0,89 |
1,02 |
0,65 |
0,97 |
11,93 |
|
|
H5 |
1,17 |
0,74 |
1,10 |
0,72 |
0,79 |
0,60 |
0,85 |
0,63 |
0,84 |
1,20 |
0,95 |
1,07 |
10,67 |
|
|
H6 |
0,95 |
0,94 |
0,77 |
1,31 |
0,86 |
0,68 |
1,00 |
1,09 |
0,93 |
1,37 |
1,23 |
1,02 |
12,14 |
|
|
H7 |
0,73 |
1,24 |
1,47 |
0,92 |
0,96 |
1,00 |
1,40 |
0,93 |
0,85 |
1,46 |
0,40 |
0,66 |
12,01 |
|
|
H8 |
0,87 |
1,09 |
0,93 |
1,13 |
0,65 |
1,07 |
0,71 |
0,65 |
0,56 |
1,18 |
0,77 |
0,89 |
10,52 |
|
|
H9 |
0,82 |
1,09 |
0,87 |
1,25 |
1,16 |
0,87 |
0,86 |
0,99 |
1,14 |
0,61 |
1,14 |
0,98 |
11,79 |
|
|
H10 |
1,30 |
0,95 |
1,04 |
0,86 |
0,55 |
0,85 |
0,80 |
1,51 |
1,33 |
0,32 |
0,92 |
0,40 |
10,84 |
|
|
H11 |
1,52 |
0,78 |
1,31 |
0,90 |
0,66 |
1,42 |
0,92 |
0,89 |
0,79 |
1,34 |
1,43 |
0,79 |
12,75 |
|
|
H12 |
1,06 |
1,43 |
1,09 |
0,78 |
1,18 |
1,08 |
0,84 |
1,44 |
1,41 |
0,58 |
0,85 |
1,58 |
13,31 |
|
Total |
|
13,60 |
12,61 |
12,56 |
12,23 |
11,01 |
11,79 |
11,15 |
11,62 |
11,91 |
12,29 |
11,05 |
12,14 |
143,95 |
North Node in Aries in H2 had 23 astrologers and 378 were found in the ADB. The effect size is 1,79 (1,07 - 2,52) with a risk of P (x<4) of 0,64 %.
North Node in Capricorn in H10 had 3 astrologers and 274 were found in the ADB. The effect size is 0,32 (0 - 0,69) with a risk of P (x>15) of 1,70 %.
Do we see effect sizes of 0,39 - 1,77 or larger in for Chiron in sign and House? Yes many.
|
|
|
Aries |
Tau |
Gemini |
Cancer |
Leo |
Virgo |
Libra |
Scorp |
Sag |
Cap |
|
Pisces |
Total |
|
Chiron |
H1 |
0,77 |
0,61 |
1,09 |
0,88 |
2,29 |
0,85 |
1,20 |
1,18 |
1,86 |
1,52 |
1,14 |
0,66 |
14,06 |
|
in |
H2 |
0,99 |
1,00 |
0,66 |
1,25 |
1,36 |
1,29 |
1,60 |
1,55 |
1,00 |
0,74 |
1,49 |
1,21 |
14,15 |
|
|
H3 |
0,72 |
0,60 |
0,83 |
1,05 |
0,98 |
1,69 |
1,37 |
0,93 |
1,41 |
1,32 |
1,13 |
0,76 |
12,80 |
|
|
H4 |
0,78 |
0,82 |
1,04 |
1,34 |
0,89 |
1,40 |
1,23 |
1,34 |
1,68 |
1,44 |
1,03 |
1,04 |
14,03 |
|
|
H5 |
0,67 |
0,44 |
1,20 |
0,86 |
1,02 |
0,63 |
0,81 |
1,00 |
0,88 |
1,62 |
0,79 |
0,96 |
10,88 |
|
|
H6 |
0,71 |
1,27 |
0,39 |
0,44 |
0,78 |
1,20 |
1,85 |
1,66 |
1,75 |
1,15 |
0,66 |
0,85 |
12,71 |
|
|
H7 |
0,52 |
1,04 |
0,99 |
0,95 |
0,95 |
1,11 |
1,61 |
0,96 |
1,21 |
1,81 |
0,58 |
0,85 |
12,57 |
|
|
H8 |
0,64 |
0,59 |
0,65 |
1,33 |
1,00 |
1,28 |
0,51 |
1,34 |
2,13 |
0,76 |
1,53 |
1,03 |
12,79 |
|
|
H9 |
0,69 |
0,71 |
0,65 |
0,84 |
0,65 |
1,05 |
1,07 |
1,42 |
1,77 |
0,77 |
0,91 |
1,34 |
11,86 |
|
|
H10 |
0,89 |
0,64 |
1,04 |
1,03 |
0,24 |
1,59 |
1,74 |
1,98 |
1,28 |
2,39 |
0,89 |
1,19 |
14,92 |
|
|
H11 |
0,74 |
0,74 |
0,70 |
0,58 |
1,79 |
1,50 |
1,43 |
1,03 |
1,50 |
1,54 |
0,99 |
0,79 |
13,35 |
|
|
H12 |
0,71 |
0,80 |
0,75 |
0,96 |
1,86 |
1,49 |
1,97 |
0,98 |
1,54 |
1,84 |
1,20 |
0,97 |
15,06 |
|
Total |
|
8,83 |
9,25 |
10,00 |
11,52 |
13,82 |
15,10 |
16,40 |
15,37 |
18,01 |
16,90 |
12,34 |
11,67 |
159,19 |
Also in the case of Chiron in sign there is a generational effect, which has to be taken into account, as the ADB is not evenly distributed.
|
Chiron in |
|
Aries |
Tau |
Gemini |
Cancer |
Leo |
Virgo |
Libra |
Scorp |
Sag |
Cap |
Aqua |
Pisces |
Total |
|
Astrologers |
231 |
196 |
131 |
107 |
101 |
81 |
97 |
114 |
146 |
182 |
210 |
271 |
1867 |
|
|
Expected |
315 |
255 |
159 |
111 |
88 |
64 |
71 |
89 |
99 |
131 |
205 |
280 |
1867 |
|
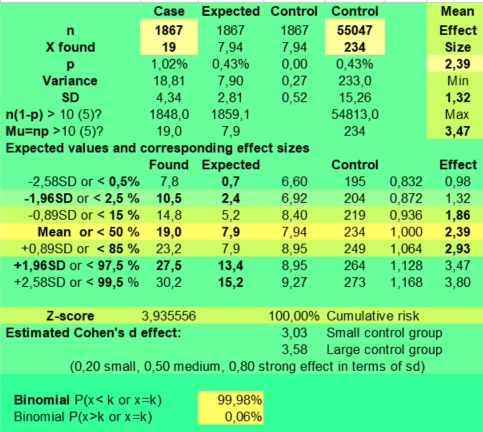 It
also produces more variation, which increases the risk of getting a
false positive. But on closer inspection only Chiron in Leo in H1
(p=0,031) and Chiron in Capricorn in H10 (p=0,0006) were
statistically significant with an alpha of 0,01.
It
also produces more variation, which increases the risk of getting a
false positive. But on closer inspection only Chiron in Leo in H1
(p=0,031) and Chiron in Capricorn in H10 (p=0,0006) were
statistically significant with an alpha of 0,01.
Chiron in Gemini in H6 had 4 astrologers and 302 were found in the ADB. The effect size is 0,39 (0,01 - 0,77) with a risk of P (x<5) of 2,52 %.
Chiron in Leo in H1 had 15 astrologers and 193 were found in the ADB. The effect size is 2,29 (1,14 - 3,45) with a risk of P (x>14) of 0,31 %.
Chiron in Leo in H10 had 2 astrologers and 243 were found in the ADB. The effect size is 0,24 (-0,09 - 0,58) with a risk of P (x<3) of 1,13 %.
Chiron in Leo in H11 had 14 astrologers and 230 were found in the ADB. The effect size is 1,79 (0,86 - 2,73) with a risk of P (x>13) of 2,84 %.
Chiron in Leo in H12 had 16 astrologers and 254 were found in the ADB. The effect size is 1,86 (0,95 - 2,76) with a risk of P (x>15) of 1,52 %.
Chiron in Libra in H6 had 10 astrologers and 159 were found in the ADB. The effect size is 1,85 (0,71 - 3,00) with a risk of P (x>9) of 4,81 %.
Chiron in Libra in H12 had 11 astrologers and 165 were found in the ADB. The effect size is 1,97 (0,81 - 3,12) with a risk of P (x>10) of 2,79 %.
Chiron in Scorpio in H10 had 12 astrologers and 179 were found in the ADB. The effect size is 1,98 (0,86 - 3,09) with a risk of P (x>11) of 2,15 %.
Chiron in Sagittarius in H1 had 18 astrologers and 285 were found in the ADB. The effect size is 1,86 (1,01 - 2,72) with a risk of P (x>17) of 1,03 %.
Chiron in Sagittarius in H8 had 13 astrologers and 180 were found in the ADB. The effect size is 2,13 (0,98 - 3,28) with a risk of P (x>12) of 1,00 %.
Chiron in Sagittarius in H9 had 10 astrologers and 167 were found in the ADB. The effect size is 1,77 (0,67 - 2,86) with a risk of P (x>9) of 6,24 %.
Chiron in Capricorn in H7 had 16 astrologers and 261 were found in the ADB. The effect size is 1,81 (0,93 - 2,69) with a risk of P (x>15) of 1,90 %.
Chiron in Capricorn in H10 had 19 astrologers and 234 were found in the ADB. The effect size is 2,39 (1,32 - 3,47) with a risk of P (x>18) of 0,06 %.
Chiron in Capricorn in H12 had 15 astrologers and 241 were found in the ADB. The effect size is 1,84 (0,91 - 2,76) with a risk of P (x>14) of 2,02 %.
Below you see the binomial probabilities involved with the effect sizes. The negative values refer to P(x<=k) with effect size < 1 and the positive values to P(x>k) with an effect size >1. The lowest and possibly significant probability is displayed. Significant values below 0,5% are marked yellow. The expected value np of them is 1,44 (range 0- 4) for each planet in Hand sign as explained in Data mining. Most planets, except Pluto and Neptune behaved accordingly. So even their large effect sizes could be explained by the sampling error. But the not that well astrologically documented uneven distribution in time of the ADB still presents us questions: is it real astrology effect, some bias or just Zeitgeist .
Neptune (28) and Pluto (26) had many more of them, so here astrological effects and or some bias could be expected.
|
|
|
Aries |
Taurus |
Gemini |
Cancer |
Leo |
Virgo |
Libra |
Scorpio |
Sag |
Cap |
Aqua |
Pisces |
|
Sun |
H1 |
-38,65 |
-53,31 |
-53,20 |
30,74 |
46,32 |
-20,52 |
41,12 |
-36,01 |
-4,63 |
-18,48 |
4,62 |
54,18 |
|
in |
H2 |
53,67 |
-28,84 |
-29,47 |
-10,59 |
49,21 |
-35,03 |
-37,31 |
-17,11 |
-31,22 |
37,39 |
10,88 |
-51,93 |
|
|
H3 |
11,01 |
-5,25 |
-41,52 |
28,77 |
22,35 |
-2,80 |
-2,23 |
-29,65 |
5,21 |
13,91 |
25,76 |
33,44 |
|
|
H4 |
17,05 |
50,86 |
-12,44 |
-37,47 |
-25,40 |
-2,37 |
-28,84 |
-51,71 |
15,15 |
9,61 |
50,21 |
31,76 |
|
|
H5 |
39,51 |
-8,65 |
19,21 |
-32,88 |
-51,77 |
-43,58 |
-41,25 |
26,61 |
-7,46 |
20,43 |
-38,17 |
-18,67 |
|
|
H6 |
44,74 |
44,68 |
-49,79 |
54,75 |
-12,44 |
-46,90 |
-13,68 |
40,72 |
-39,26 |
48,29 |
-25,00 |
-16,33 |
|
|
H7 |
-46,83 |
-35,70 |
-21,28 |
-24,44 |
-4,10 |
48,29 |
32,10 |
55,64 |
36,63 |
-52,58 |
-47,40 |
-0,16 |
|
|
H8 |
42,59 |
-30,87 |
48,79 |
35,77 |
48,07 |
24,40 |
46,46 |
13,78 |
21,12 |
33,32 |
33,32 |
-0,26 |
|
|
H9 |
-43,05 |
-31,18 |
-30,55 |
49,86 |
28,80 |
-26,55 |
47,61 |
43,46 |
4,39 |
-18,41 |
9,97 |
16,76 |
|
|
H10 |
13,71 |
-35,00 |
-16,08 |
-17,47 |
-33,81 |
1,03 |
33,69 |
7,77 |
43,79 |
-28,42 |
12,57 |
52,95 |
|
|
H11 |
-43,51 |
4,87 |
11,30 |
33,10 |
-13,25 |
47,00 |
-35,00 |
-28,49 |
34,57 |
20,84 |
7,26 |
-49,79 |
|
|
H12 |
13,30 |
-46,73 |
26,13 |
13,09 |
1,97 |
-37,23 |
11,69 |
53,95 |
17,14 |
-26,14 |
45,20 |
26,13 |
|
|
|
|
|
|
|
|
|
|
|
|
|
|
|
|
|
|
Aries |
Taurus |
Gemini |
Cancer |
Leo |
Virgo |
Libra |
Scorpio |
Sag |
Cap |
Aqua |
Pisces |
|
Moon |
H1 |
-44,89 |
-21,00 |
-19,81 |
31,26 |
22,98 |
-51,59 |
-4,27 |
-23,35 |
-22,72 |
6,77 |
-20,52 |
19,36 |
|
in |
H2 |
-54,02 |
37,89 |
31,91 |
-56,21 |
-44,87 |
-47,89 |
-34,66 |
-45,23 |
22,73 |
-45,54 |
0,49 |
-32,12 |
|
|
H3 |
41,31 |
9,04 |
37,08 |
-10,92 |
-12,84 |
29,94 |
13,19 |
39,62 |
-40,71 |
51,21 |
2,12 |
-33,08 |
|
|
H4 |
32,70 |
-47,84 |
3,86 |
-43,91 |
33,23 |
15,53 |
42,68 |
-29,25 |
-30,72 |
22,72 |
33,79 |
6,74 |
|
|
H5 |
-17,95 |
-53,54 |
-18,46 |
36,67 |
-13,88 |
38,98 |
-13,83 |
45,54 |
-41,90 |
-22,82 |
-14,30 |
-15,25 |
|
|
H6 |
48,81 |
49,99 |
49,11 |
-19,21 |
-50,21 |
-15,38 |
41,84 |
-9,68 |
-34,41 |
-42,88 |
45,19 |
28,04 |
|
|
H7 |
-48,50 |
-12,89 |
34,65 |
23,27 |
-16,69 |
53,62 |
-32,64 |
-32,78 |
48,23 |
24,36 |
-46,83 |
28,93 |
|
|
H8 |
51,13 |
-14,69 |
22,48 |
-35,65 |
-17,87 |
-5,43 |
22,03 |
42,75 |
3,36 |
-22,32 |
45,59 |
-22,09 |
|
|
H9 |
-39,32 |
-15,47 |
-29,98 |
12,21 |
20,28 |
-21,56 |
-37,50 |
24,51 |
2,33 |
21,82 |
37,48 |
-17,48 |
|
|
H10 |
54,75 |
-21,72 |
12,57 |
6,31 |
-6,20 |
-28,52 |
36,25 |
55,16 |
19,26 |
-25,11 |
43,89 |
27,84 |
|
|
H11 |
17,25 |
19,50 |
-35,65 |
-50,30 |
-21,24 |
40,51 |
6,26 |
-29,12 |
28,44 |
19,27 |
-15,16 |
-24,01 |
|
|
H12 |
28,04 |
23,00 |
-10,34 |
5,77 |
40,79 |
-47,51 |
-24,40 |
-31,58 |
-54,41 |
48,67 |
27,68 |
28,69 |
|
|
|
|
|
|
|
|
|
|
|
|
|
|
|
|
|
|
Aries |
Taurus |
Gemini |
Cancer |
Leo |
Virgo |
Libra |
Scorpio |
Sag |
Cap |
Aqua |
Pisces |
|
Mercury |
H1 |
-47,89 |
4,16 |
18,95 |
-42,60 |
20,29 |
35,15 |
26,33 |
-25,63 |
-9,75 |
1,44 |
-7,16 |
3,20 |
|
in |
H2 |
-16,54 |
-26,72 |
-17,25 |
-5,16 |
50,21 |
39,60 |
-16,07 |
36,77 |
32,26 |
-47,27 |
34,05 |
5,36 |
|
|
H3 |
-13,46 |
-4,45 |
25,82 |
-31,68 |
-49,14 |
-32,64 |
-31,18 |
27,63 |
14,95 |
21,94 |
9,01 |
44,15 |
|
|
H4 |
53,91 |
30,04 |
-39,67 |
-51,18 |
-4,57 |
-21,53 |
-22,35 |
-30,26 |
14,93 |
12,07 |
-18,65 |
18,05 |
|
|
H5 |
24,86 |
-19,21 |
40,81 |
-23,77 |
-35,76 |
-50,21 |
-32,31 |
35,77 |
-4,99 |
20,81 |
-11,14 |
-23,17 |
|
|
H6 |
-39,60 |
38,86 |
39,43 |
-30,41 |
-7,73 |
-38,70 |
-32,83 |
-44,89 |
-44,54 |
45,92 |
-0,10 |
-3,45 |
|
|
H7 |
50,41 |
-0,49 |
34,80 |
-17,95 |
-30,46 |
-7,87 |
12,30 |
-27,73 |
41,34 |
-30,52 |
-9,86 |
-48,55 |
|
|
H8 |
-22,03 |
-30,80 |
-27,30 |
44,42 |
38,48 |
-40,36 |
6,69 |
2,75 |
-34,10 |
5,80 |
50,21 |
-31,58 |
|
|
H9 |
1,60 |
-23,09 |
-12,82 |
41,23 |
4,96 |
42,96 |
-53,25 |
15,59 |
36,28 |
39,64 |
2,99 |
33,33 |
|
|
H10 |
-48,37 |
22,20 |
20,89 |
-7,51 |
-17,76 |
8,15 |
-50,55 |
43,04 |
-51,46 |
42,19 |
-46,76 |
23,83 |
|
|
H11 |
-40,18 |
42,14 |
39,78 |
30,49 |
-14,85 |
-23,23 |
25,00 |
43,71 |
33,49 |
48,41 |
1,16 |
27,11 |
|
|
H12 |
-0,59 |
18,04 |
36,26 |
10,05 |
46,47 |
-44,87 |
25,90 |
-16,52 |
15,29 |
-28,16 |
17,04 |
-46,33 |
|
|
|
|
|
|
|
|
|
|
|
|
|
|
|
|
|
|
Aries |
Taurus |
Gemini |
Cancer |
Leo |
Virgo |
Libra |
Scorpio |
Sag |
Cap |
Aqua |
Pisces |
|
Venus |
H1 |
-48,93 |
51,20 |
-46,12 |
48,41 |
3,06 |
-37,87 |
-24,44 |
21,96 |
-39,96 |
6,48 |
22,41 |
-19,14 |
|
in |
H2 |
-46,01 |
32,60 |
-41,11 |
15,20 |
-19,84 |
-50,85 |
-49,41 |
1,03 |
-30,66 |
-38,51 |
22,94 |
4,75 |
|
|
H3 |
16,79 |
-20,06 |
52,50 |
12,52 |
-10,40 |
-10,68 |
-47,61 |
3,08 |
-41,25 |
-54,08 |
-52,31 |
9,23 |
|
|
H4 |
-45,66 |
-15,22 |
37,52 |
-34,32 |
-5,05 |
12,98 |
-13,88 |
-28,51 |
-5,81 |
43,71 |
46,53 |
28,69 |
|
|
H5 |
23,42 |
-25,73 |
-12,00 |
-0,42 |
-16,95 |
49,83 |
-6,03 |
-36,03 |
43,04 |
-30,46 |
52,10 |
-17,24 |
|
|
H6 |
-20,06 |
-19,28 |
-42,14 |
27,68 |
-12,00 |
-36,76 |
-36,37 |
-33,98 |
41,70 |
-43,36 |
-38,42 |
50,59 |
|
|
H7 |
-14,63 |
16,30 |
22,16 |
-42,49 |
55,50 |
5,49 |
17,74 |
-37,11 |
-44,36 |
1,16 |
-10,92 |
12,80 |
|
|
H8 |
-20,78 |
-24,30 |
-32,44 |
31,27 |
-4,43 |
-11,81 |
-19,81 |
39,64 |
-47,05 |
27,52 |
-19,26 |
-24,14 |
|
|
H9 |
48,55 |
26,05 |
-23,58 |
-16,19 |
20,01 |
10,97 |
-29,38 |
22,66 |
10,11 |
-46,64 |
2,05 |
-34,85 |
|
|
H10 |
-24,54 |
0,79 |
-1,50 |
-47,19 |
-9,31 |
-44,20 |
20,84 |
18,95 |
24,91 |
-52,12 |
19,45 |
35,52 |
|
|
H11 |
4,79 |
29,83 |
12,26 |
0,72 |
-6,01 |
22,97 |
-24,45 |
-11,13 |
15,33 |
-46,14 |
18,31 |
52,87 |
|
|
H12 |
53,19 |
-1,41 |
41,63 |
-52,07 |
-16,48 |
-49,30 |
16,03 |
55,50 |
-19,56 |
9,10 |
-46,38 |
29,74 |
|
|
|
|
|
|
|
|
|
|
|
|
|
|
|
|
|
|
Aries |
Taurus |
Gemini |
Cancer |
Leo |
Virgo |
Libra |
Scorpio |
Sag |
Cap |
Aqua |
Pisces |
|
Mars |
H1 |
-22,32 |
39,51 |
-13,67 |
-50,62 |
34,45 |
-29,65 |
27,91 |
-12,22 |
7,00 |
43,04 |
-5,43 |
42,48 |
|
in |
H2 |
-6,14 |
-40,70 |
21,40 |
55,93 |
35,15 |
-51,93 |
15,53 |
-48,97 |
5,30 |
12,66 |
-1,65 |
20,47 |
|
|
H3 |
-26,38 |
26,93 |
-40,30 |
35,48 |
-23,17 |
-25,28 |
-31,02 |
-40,93 |
34,42 |
-54,80 |
-20,89 |
33,23 |
|
|
H4 |
6,12 |
-50,01 |
48,96 |
22,03 |
27,65 |
-36,71 |
-44,54 |
-17,54 |
9,87 |
-39,32 |
43,97 |
-34,32 |
|
|
H5 |
35,83 |
29,20 |
41,10 |
42,75 |
35,15 |
19,62 |
-1,22 |
13,30 |
-5,16 |
-37,39 |
-2,62 |
23,42 |
|
|
H6 |
-23,47 |
-51,77 |
27,63 |
47,70 |
-55,58 |
-31,66 |
-4,42 |
44,49 |
-20,30 |
1,63 |
48,81 |
-48,96 |
|
|
H7 |
38,70 |
-53,68 |
-22,59 |
-9,28 |
6,22 |
31,94 |
-37,81 |
42,09 |
27,63 |
-12,23 |
-44,36 |
-34,92 |
|
|
H8 |
-48,40 |
-28,81 |
7,48 |
-43,57 |
-14,61 |
47,20 |
24,40 |
18,39 |
-34,92 |
-24,70 |
33,74 |
29,63 |
|
|
H9 |
-46,44 |
-36,71 |
49,70 |
-46,73 |
-2,91 |
32,24 |
23,49 |
-39,50 |
8,14 |
-4,10 |
2,22 |
34,28 |
|
|
H10 |
30,63 |
-35,36 |
-53,53 |
50,53 |
-46,96 |
-25,38 |
-30,87 |
40,53 |
-34,51 |
56,21 |
-33,69 |
31,91 |
|
|
H11 |
8,61 |
10,97 |
34,81 |
46,10 |
-3,51 |
35,06 |
24,41 |
-34,48 |
-30,14 |
-48,09 |
6,94 |
54,72 |
|
|
H12 |
40,34 |
-24,01 |
38,78 |
53,66 |
5,71 |
-9,53 |
54,39 |
43,56 |
12,53 |
-43,47 |
43,46 |
20,17 |
|
|
|
|
|
|
|
|
|
|
|
|
|
|
|
|
|
|
Aries |
Taurus |
Gemini |
Cancer |
Leo |
Virgo |
Libra |
Scorpio |
Sag |
Cap |
Aqua |
Pisces |
|
Jupiter |
H1 |
41,13 |
31,67 |
-7,79 |
46,46 |
-29,16 |
-35,69 |
-24,60 |
2,03 |
-35,30 |
15,37 |
9,90 |
-27,27 |
|
in |
H2 |
-5,55 |
22,48 |
-42,60 |
-33,54 |
39,76 |
-27,02 |
-25,62 |
39,09 |
40,25 |
-23,49 |
42,48 |
20,01 |
|
|
H3 |
8,27 |
-45,27 |
-47,96 |
55,16 |
-31,93 |
5,95 |
-19,37 |
-20,70 |
27,48 |
-25,92 |
44,48 |
-35,36 |
|
|
H4 |
-19,52 |
31,91 |
-51,65 |
-32,40 |
55,93 |
-20,79 |
12,91 |
-11,65 |
4,93 |
-17,54 |
0,82 |
48,41 |
|
|
H5 |
39,51 |
46,90 |
-50,72 |
46,90 |
-33,74 |
-24,17 |
52,10 |
17,36 |
-27,50 |
-13,60 |
-38,65 |
47,14 |
|
|
H6 |
50,63 |
14,60 |
-41,30 |
-44,84 |
29,87 |
45,58 |
50,57 |
-25,14 |
-6,75 |
24,37 |
4,27 |
48,68 |
|
|
H7 |
-8,00 |
-0,80 |
23,83 |
48,32 |
-54,11 |
-42,49 |
12,57 |
-41,31 |
27,68 |
-17,25 |
-46,97 |
7,77 |
|
|
H8 |
-30,13 |
-34,37 |
-36,01 |
-4,74 |
19,37 |
55,12 |
52,23 |
17,02 |
-32,78 |
21,89 |
31,91 |
-53,20 |
|
|
H9 |
-13,09 |
-54,42 |
-46,33 |
-5,78 |
21,67 |
-44,89 |
-22,35 |
-22,65 |
22,35 |
50,21 |
2,68 |
-48,96 |
|
|
H10 |
-26,35 |
4,11 |
9,51 |
31,96 |
-46,88 |
-10,68 |
-15,87 |
-30,53 |
15,45 |
8,34 |
-28,07 |
34,75 |
|
|
H11 |
-49,59 |
48,55 |
53,31 |
-40,28 |
-38,69 |
-54,81 |
9,92 |
16,28 |
-9,19 |
18,24 |
21,21 |
47,70 |
|
|
H12 |
-41,84 |
10,20 |
-43,12 |
52,78 |
-35,96 |
-19,59 |
-31,62 |
38,98 |
14,03 |
43,34 |
16,41 |
-38,62 |
|
|
|
|
|
|
|
|
|
|
|
|
|
|
|
|
|
|
Aries |
Taurus |
Gemini |
Cancer |
Leo |
Virgo |
Libra |
Scorpio |
Sag |
Cap |
Aqua |
Pisces |
|
Saturn |
H1 |
29,87 |
-49,14 |
28,82 |
-37,47 |
18,97 |
16,55 |
43,76 |
-15,08 |
30,26 |
-10,34 |
-20,93 |
-17,87 |
|
in |
H2 |
-9,86 |
-36,37 |
-2,51 |
-9,14 |
-3,11 |
27,93 |
-51,45 |
7,60 |
12,78 |
-24,89 |
49,88 |
-14,94 |
|
|
H3 |
16,96 |
-26,84 |
49,28 |
12,44 |
-30,19 |
47,91 |
20,28 |
52,10 |
26,26 |
49,73 |
44,49 |
-14,72 |
|
|
H4 |
-30,87 |
-51,33 |
7,80 |
-34,51 |
-53,20 |
4,16 |
-15,67 |
-41,34 |
-13,58 |
44,50 |
-8,46 |
-29,50 |
|
|
H5 |
-47,40 |
46,43 |
-43,03 |
10,45 |
52,60 |
44,08 |
-16,32 |
-54,48 |
-28,74 |
-1,34 |
-5,69 |
-6,43 |
|
|
H6 |
9,32 |
42,61 |
21,12 |
-37,04 |
5,46 |
-41,25 |
45,20 |
44,83 |
24,00 |
31,08 |
-49,79 |
-7,62 |
|
|
H7 |
-19,28 |
-13,54 |
-37,98 |
36,85 |
9,51 |
9,71 |
31,31 |
-41,31 |
-37,50 |
-10,38 |
-33,37 |
-13,88 |
|
|
H8 |
-31,22 |
-24,44 |
-12,99 |
11,78 |
6,13 |
-20,27 |
29,61 |
37,82 |
-5,57 |
31,52 |
-41,10 |
6,27 |
|
|
H9 |
-11,43 |
-45,27 |
-5,53 |
1,90 |
37,76 |
29,61 |
38,71 |
5,75 |
49,99 |
-52,79 |
7,26 |
15,45 |
|
|
H10 |
12,96 |
51,50 |
48,32 |
-3,58 |
24,97 |
-48,50 |
-31,33 |
20,78 |
35,89 |
7,63 |
-50,01 |
31,16 |
|
|
H11 |
26,25 |
-49,60 |
53,12 |
47,36 |
-50,65 |
39,96 |
51,73 |
14,45 |
39,10 |
46,00 |
19,81 |
-8,28 |
|
|
H12 |
-15,04 |
6,97 |
42,81 |
25,84 |
35,11 |
-12,64 |
0,30 |
21,40 |
-48,13 |
-9,52 |
37,05 |
-30,80 |
|
|
|
|
|
|
|
|
|
|
|
|
|
|
|
|
|
|
Aries |
Taurus |
Gemini |
Cancer |
Leo |
Virgo |
Libra |
Scorpio |
Sag |
Cap |
Aqua |
Pisces |
|
Uranus |
H1 |
31,58 |
16,79 |
26,20 |
11,24 |
19,26 |
-52,30 |
-25,46 |
-19,42 |
-41,25 |
-23,35 |
13,82 |
30,04 |
|
in |
H2 |
-14,63 |
43,16 |
20,29 |
52,69 |
34,36 |
-41,11 |
-46,83 |
1,86 |
-19,53 |
-31,81 |
-29,16 |
-32,12 |
|
|
H3 |
-7,96 |
-33,74 |
26,61 |
15,97 |
43,16 |
-24,14 |
-13,04 |
7,65 |
-49,60 |
27,11 |
-33,64 |
-30,13 |
|
|
H4 |
-16,54 |
-28,16 |
25,32 |
8,68 |
-28,64 |
-19,00 |
-32,83 |
-32,49 |
26,20 |
-31,71 |
-47,13 |
34,78 |
|
|
H5 |
27,84 |
-15,60 |
9,92 |
1,82 |
-43,58 |
-22,03 |
-10,10 |
19,24 |
-27,59 |
-1,81 |
-19,04 |
18,04 |
|
|
H6 |
-11,64 |
14,21 |
18,05 |
-51,19 |
24,61 |
-5,47 |
-0,89 |
-2,47 |
15,15 |
-17,87 |
-49,41 |
-17,33 |
|
|
H7 |
-12,06 |
-10,09 |
2,50 |
0,93 |
-55,16 |
-14,42 |
-27,05 |
39,76 |
-18,72 |
10,19 |
7,45 |
-24,72 |
|
|
H8 |
-1,17 |
-40,71 |
0,50 |
15,80 |
-44,52 |
17,57 |
-35,23 |
-28,03 |
-11,11 |
-41,30 |
34,99 |
-16,32 |
|
|
H9 |
-32,84 |
-38,38 |
-33,69 |
17,03 |
-48,50 |
-52,93 |
-14,54 |
-38,79 |
41,28 |
-52,21 |
-22,52 |
-39,32 |
|
|
H10 |
54,39 |
48,55 |
33,29 |
2,31 |
16,00 |
27,93 |
8,96 |
47,88 |
3,36 |
54,79 |
33,74 |
-6,94 |
|
|
H11 |
39,10 |
14,71 |
0,27 |
11,77 |
-8,76 |
-15,67 |
-13,25 |
25,68 |
-45,21 |
-42,60 |
20,52 |
13,30 |
|
|
H12 |
-37,64 |
2,77 |
-41,90 |
53,27 |
-47,77 |
-11,98 |
-2,82 |
-46,16 |
32,80 |
-4,70 |
11,32 |
-9,74 |
|
|
|
|
|
|
|
|
|
|
|
|
|
|
|
|
|
|
Aries |
Taurus |
Gemini |
Cancer |
Leo |
Virgo |
Libra |
Scorpio |
Sag |
Cap |
Aqua |
Pisces |
|
Neptune |
H1 |
-20,04 |
-23,74 |
33,73 |
0,12 |
52,87 |
-25,71 |
45,58 |
-12,42 |
-0,01 |
-0,01 |
-8,84 |
-23,75 |
|
in |
H2 |
44,68 |
-38,19 |
0,99 |
6,01 |
-30,10 |
37,97 |
0,17 |
-0,89 |
-0,00 |
-0,41 |
-5,25 |
-56,24 |
|
|
H3 |
-56,50 |
3,75 |
4,47 |
18,39 |
43,87 |
16,26 |
1,05 |
-19,99 |
-0,00 |
-0,22 |
-1,17 |
-29,66 |
|
|
H4 |
-4,31 |
23,01 |
6,91 |
9,69 |
8,11 |
6,65 |
20,08 |
-54,00 |
-0,03 |
-0,02 |
-0,68 |
-22,77 |
|
|
H5 |
-30,18 |
9,25 |
0,61 |
5,46 |
-39,47 |
8,74 |
21,09 |
53,28 |
-0,26 |
-0,07 |
-7,33 |
-6,56 |
|
|
H6 |
-32,33 |
1,67 |
16,44 |
51,45 |
32,85 |
41,62 |
9,56 |
-0,94 |
-0,01 |
-0,09 |
-0,47 |
-33,45 |
|
|
H7 |
-45,04 |
1,59 |
0,02 |
1,91 |
16,69 |
-40,03 |
0,44 |
52,78 |
-0,01 |
-0,28 |
-14,75 |
-1,59 |
|
|
H8 |
-28,88 |
-28,07 |
18,05 |
46,73 |
-41,11 |
-7,18 |
1,68 |
24,37 |
-0,06 |
-0,12 |
-2,47 |
-11,94 |
|
|
H9 |
45,86 |
14,29 |
0,00 |
11,60 |
-46,85 |
28,22 |
2,57 |
-2,40 |
-0,01 |
-1,14 |
-11,02 |
29,26 |
|
|
H10 |
-32,22 |
30,44 |
0,04 |
7,71 |
0,75 |
30,62 |
0,09 |
-29,05 |
-0,06 |
-0,57 |
-3,24 |
-32,18 |
|
|
H11 |
16,91 |
-50,45 |
1,73 |
53,04 |
-21,37 |
-2,20 |
1,69 |
-1,01 |
-0,42 |
-0,25 |
-2,83 |
-14,37 |
|
|
H12 |
-23,04 |
-3,01 |
0,05 |
4,45 |
47,47 |
-18,10 |
2,68 |
12,91 |
-2,39 |
-0,19 |
-2,64 |
17,91 |
|
|
|
|
|
|
|
|
|
|
|
|
|
|
|
|
|
|
Aries |
Taurus |
Gemini |
Cancer |
Leo |
Virgo |
Libra |
Scorpio |
Sag |
Cap |
Aqua |
Pisces |
|
Pluto |
H1 |
-21,78 |
-37,52 |
4,57 |
47,93 |
2,17 |
-37,87 |
-0,01 |
-0,33 |
-6,18 |
-48,40 |
-56,03 |
-3,59 |
|
in |
2 |
-11,71 |
-31,29 |
15,41 |
6,51 |
24,85 |
-23,49 |
-3,91 |
-0,28 |
-8,39 |
36,92 |
63,86 |
-18,64 |
|
|
H3 |
-0,86 |
45,16 |
0,09 |
5,35 |
20,00 |
-24,39 |
-0,05 |
-0,32 |
-5,04 |
-16,56 |
-27,55 |
-42,65 |
|
|
H4 |
-14,72 |
43,16 |
0,37 |
-53,35 |
10,48 |
-22,47 |
-0,90 |
-1,01 |
-7,84 |
-57,18 |
-33,77 |
-17,70 |
|
|
H5 |
-5,40 |
-49,14 |
0,61 |
10,97 |
5,01 |
-34,70 |
-0,06 |
-0,17 |
-5,98 |
-15,47 |
-29,48 |
-3,47 |
|
|
H6 |
-5,71 |
-41,93 |
0,70 |
39,16 |
5,00 |
-29,98 |
-0,06 |
-0,06 |
-24,00 |
-22,47 |
29,56 |
-46,67 |
|
|
H7 |
-1,17 |
24,11 |
0,03 |
-20,08 |
4,92 |
-17,66 |
-0,02 |
-5,87 |
-11,02 |
-27,55 |
-52,49 |
-36,81 |
|
|
H8 |
-8,43 |
-23,33 |
0,20 |
40,61 |
0,22 |
-13,25 |
-1,29 |
-4,69 |
-24,05 |
-44,30 |
-37,39 |
-5,98 |
|
|
H9 |
-1,25 |
-14,32 |
0,03 |
5,21 |
0,03 |
-5,38 |
-0,18 |
-0,92 |
-17,72 |
-32,64 |
-47,41 |
-3,98 |
|
|
H10 |
-18,70 |
24,92 |
0,26 |
-20,21 |
37,85 |
-47,27 |
-0,22 |
-0,95 |
-17,72 |
-37,39 |
41,88 |
-18,64 |
|
|
H11 |
-4,93 |
-51,21 |
1,61 |
-3,70 |
0,48 |
-4,64 |
-0,01 |
-0,48 |
-24,05 |
-47,41 |
-45,83 |
-2,02 |
|
|
H12 |
-6,31 |
-42,07 |
0,00 |
28,03 |
1,53 |
-0,52 |
-0,01 |
-1,21 |
-21,72 |
-33,77 |
-49,05 |
-18,64 |
|
|
|
|
|
|
|
|
|
|
|
|
|
|
|
|
|
|
Aries |
Taurus |
Gemini |
Cancer |
Leo |
Virgo |
Libra |
Scorpio |
Sag |
Cap |
Aqua |
Pisces |
|
North |
H1 |
11,88 |
25,28 |
-31,58 |
-31,65 |
-46,90 |
28,26 |
-44,52 |
9,87 |
8,03 |
30,88 |
-49,96 |
27,52 |
|
Node |
H2 |
0,64 |
12,74 |
-33,16 |
23,15 |
-19,84 |
51,99 |
-11,25 |
-11,11 |
-4,66 |
-28,46 |
-32,44 |
-46,33 |
|
in |
H3 |
53,24 |
-16,28 |
30,35 |
44,74 |
5,85 |
19,24 |
-49,03 |
-3,74 |
24,37 |
20,89 |
-46,97 |
1,64 |
|
|
H4 |
-54,80 |
47,28 |
33,49 |
28,03 |
50,21 |
-20,20 |
17,25 |
-45,92 |
-39,17 |
49,70 |
-11,14 |
-52,28 |
|
|
H5 |
31,16 |
-25,08 |
41,34 |
-22,32 |
-29,84 |
-8,62 |
-34,37 |
-10,04 |
-31,13 |
23,79 |
-47,90 |
43,04 |
|
|
H6 |
-50,17 |
-50,21 |
-29,47 |
21,55 |
-39,90 |
-15,25 |
53,03 |
40,15 |
-44,87 |
9,51 |
22,44 |
50,92 |
|
|
H7 |
-18,20 |
19,87 |
4,05 |
-42,88 |
-50,85 |
54,04 |
10,85 |
-48,55 |
-40,44 |
12,97 |
-2,82 |
-16,65 |
|
|
H8 |
-38,42 |
38,94 |
-45,54 |
32,55 |
-10,38 |
43,71 |
-19,17 |
-18,35 |
-16,46 |
33,32 |
-27,19 |
-42,60 |
|
|
H9 |
-29,95 |
38,77 |
-33,81 |
17,79 |
29,42 |
-38,42 |
-38,25 |
55,53 |
37,97 |
-14,48 |
37,52 |
-54,80 |
|
|
H10 |
16,79 |
-49,43 |
45,78 |
-33,81 |
-4,82 |
-35,03 |
-29,81 |
7,97 |
20,20 |
-1,70 |
-47,31 |
-1,41 |
|
|
H11 |
3,41 |
-23,23 |
12,26 |
-39,16 |
-10,09 |
9,40 |
-46,83 |
-45,25 |
-32,40 |
20,48 |
12,09 |
-27,89 |
|
|
H12 |
44,49 |
7,47 |
37,83 |
-21,52 |
26,62 |
41,59 |
-33,98 |
10,82 |
15,20 |
-13,81 |
-37,92 |
3,34 |
|
|
|
|
|
|
|
|
|
|
|
|
|
|
|
|
|
|
Aries |
Taurus |
Gemini |
Cancer |
Leo |
Virgo |
Libra |
Scorpio |
Sag |
Cap |
Aqua |
Pisces |
|
Chiron |
H1 |
-15,80 |
-5,30 |
42,61 |
-48,23 |
0,31 |
-49,81 |
34,88 |
33,74 |
1,03 |
4,19 |
30,03 |
-4,38 |
|
in |
H2 |
-53,36 |
52,63 |
-16,65 |
29,58 |
23,78 |
30,23 |
9,02 |
7,62 |
53,51 |
-20,78 |
2,66 |
17,12 |
|
|
H3 |
-10,22 |
-5,60 |
-37,93 |
48,97 |
57,13 |
9,11 |
21,36 |
-50,72 |
11,25 |
15,58 |
31,13 |
-13,78 |
|
|
H4 |
-15,45 |
-26,96 |
49,55 |
21,89 |
-49,27 |
23,55 |
32,89 |
19,21 |
2,56 |
7,06 |
48,12 |
44,15 |
|
|
H5 |
-5,71 |
-0,59 |
30,35 |
-45,65 |
53,33 |
-29,66 |
-41,80 |
54,75 |
-43,17 |
1,86 |
-19,48 |
-46,96 |
|
|
H6 |
-8,45 |
14,20 |
-2,47 |
-8,76 |
-37,68 |
38,15 |
4,81 |
4,18 |
1,84 |
33,04 |
-7,45 |
-26,31 |
|
|
H7 |
-0,29 |
45,81 |
54,18 |
-50,39 |
-53,05 |
45,27 |
9,85 |
-58,28 |
36,15 |
1,90 |
-6,65 |
-29,08 |
|
|
H8 |
-3,20 |
-1,80 |
-9,66 |
16,76 |
54,31 |
28,96 |
-15,98 |
25,16 |
1,00 |
-32,92 |
4,02 |
47,51 |
|
|
H9 |
-5,24 |
-7,58 |
-8,89 |
-35,67 |
-22,33 |
51,05 |
50,19 |
20,66 |
6,24 |
-33,78 |
-43,12 |
6,74 |
|
|
H10 |
-31,96 |
-3,58 |
46,19 |
49,21 |
-1,13 |
11,98 |
6,64 |
2,15 |
28,96 |
0,06 |
-40,34 |
20,93 |
|
|
H11 |
-8,39 |
-12,42 |
-12,76 |
-10,92 |
2,84 |
16,91 |
22,08 |
52,18 |
13,53 |
7,80 |
54,75 |
-19,87 |
|
|
H12 |
-6,84 |
-17,87 |
-18,70 |
-52,39 |
1,52 |
17,31 |
2,79 |
57,13 |
15,36 |
2,02 |
25,26 |
-50,63 |
Having Lord II in XI is positively associated with being an astrologer. It would imply that second house affairs like money, property and personal taste serve the eleventh house of friends and groups. It is very significant (p=0,0015), but the effect size is rather low (1,23, read some 23% more often). So it does not apply to most astrologers. The reverse situation, having Lord XI in II is less likely (effect size 0,88 ).
Having Lord I in VI is less likely for an astrologer. It is significant (p=0,0042), but the effect size is small (0,79).
When using modern house rulers, much more variation and thus significant values (15) were found than expected (144/100 = 1,44) with an alpha of 0,01. But large effect sizes were not seen. The three largest effect sizes were 1,30 for Lord III in IX and Lord IV in X and 1,20 for Lord IX in IIII.
Small talk (III) serves a greater philosophy of life (IX) and the reverse. That is an interesting outcome. Because the interpretation of having Lord IV in X is also interesting: What happens at home, say in the intimate private sphere, is made public. But we do not see this pattern in the ADB category autobiographers, who tend to have Lord IV in I.
Traditional House Rulership
|
% risk |
H1 |
H2 |
H3 |
H4 |
H5 |
H6 |
H7 |
H8 |
H9 |
H10 |
H11 |
H12 |
|
Lord 1 |
-40,75 |
-37,34 |
-34,06 |
27,39 |
-43,69 |
-0,42 |
21,32 |
39,17 |
-39,50 |
-9,86 |
5,43 |
2,83 |
|
Lord 2 |
51,24 |
47,70 |
-14,83 |
-13,98 |
-21,07 |
51,04 |
-28,35 |
46,40 |
28,51 |
26,16 |
0,15 |
-14,49 |
|
Lord 3 |
51,13 |
43,58 |
-43,48 |
40,80 |
-0,32 |
-17,15 |
42,49 |
-25,44 |
0,96 |
-41,47 |
27,44 |
20,54 |
|
Lord 4 |
24,07 |
-46,85 |
-40,39 |
-0,49 |
-1,10 |
-43,85 |
-16,26 |
-51,58 |
19,33 |
13,49 |
18,65 |
0,93 |
|
Lord 5 |
10,14 |
15,45 |
-5,30 |
-37,74 |
-27,04 |
-28,69 |
-2,12 |
-38,04 |
25,51 |
-41,31 |
2,24 |
31,68 |
|
Lord 6 |
-24,45 |
3,67 |
33,64 |
-45,93 |
-6,77 |
-16,87 |
-2,34 |
12,68 |
37,63 |
16,63 |
13,07 |
-25,72 |
|
Lord 7 |
37,62 |
42,38 |
24,28 |
-26,30 |
-0,91 |
-26,18 |
-47,73 |
36,54 |
13,64 |
37,07 |
29,01 |
48,97 |
|
Lord 8 |
43,47 |
-22,68 |
-20,91 |
31,19 |
-3,15 |
-51,44 |
42,82 |
-50,57 |
19,19 |
28,97 |
49,45 |
13,21 |
|
Lord 9 |
-6,33 |
-45,79 |
2,49 |
25,47 |
-0,31 |
42,32 |
-23,34 |
41,11 |
44,00 |
43,22 |
-13,72 |
0,52 |
|
Lord 10 |
-45,36 |
-15,94 |
14,64 |
2,27 |
-14,93 |
-13,56 |
-20,46 |
-14,88 |
14,02 |
-49,59 |
2,09 |
-16,07 |
|
Lord 11 |
17,22 |
-5,37 |
44,68 |
-28,94 |
-13,11 |
-38,24 |
-10,37 |
-14,54 |
0,54 |
4,42 |
-45,52 |
26,00 |
|
Lord 12 |
9,47 |
-22,33 |
35,72 |
34,31 |
44,50 |
-18,71 |
9,12 |
-18,53 |
47,51 |
-4,42 |
19,06 |
-39,26 |
|
|
|
|
|
|
|
Modern |
House |
Rulership |
|
|
|
|
|
% risk |
H1 |
H2 |
H3 |
H4 |
H5 |
H6 |
H7 |
H8 |
H9 |
H10 |
H11 |
H12 |
|
Lord 1 |
-50,79 |
-1,46 |
47,47 |
21,11 |
21,23 |
-2,18 |
7,97 |
-37,63 |
29,66 |
6,81 |
-11,87 |
44,42 |
|
Lord 2 |
-3,13 |
-9,01 |
-4,23 |
-17,83 |
-15,77 |
36,58 |
8,93 |
-49,96 |
5,72 |
19,45 |
1,48 |
-38,04 |
|
Lord 3 |
-20,12 |
-0,07 |
-0,17 |
-4,66 |
-37,74 |
-32,82 |
4,41 |
-46,34 |
0,00 |
5,07 |
21,28 |
-46,02 |
|
Lord 4 |
-43,09 |
-14,02 |
-0,49 |
-0,08 |
-11,19 |
-18,69 |
42,42 |
0,84 |
11,80 |
0,00 |
-17,39 |
17,33 |
|
Lord 5 |
-19,13 |
35,70 |
29,74 |
-1,33 |
-1,88 |
-0,47 |
-31,05 |
-48,04 |
0,40 |
2,70 |
20,58 |
17,76 |
|
Lord 6 |
43,03 |
19,32 |
-16,37 |
-7,80 |
-0,02 |
-0,16 |
-23,98 |
51,43 |
0,04 |
0,98 |
20,67 |
30,70 |
|
Lord 7 |
22,25 |
26,03 |
35,70 |
-12,33 |
-7,78 |
0,00 |
-45,41 |
32,63 |
1,38 |
-49,62 |
0,65 |
-14,43 |
|
Lord 8 |
-35,54 |
19,77 |
4,78 |
-30,56 |
-33,06 |
-16,99 |
-8,39 |
-2,31 |
26,61 |
31,68 |
2,01 |
-28,53 |
|
Lord 9 |
-21,62 |
20,71 |
0,39 |
11,24 |
-0,15 |
-47,98 |
-51,55 |
-0,22 |
-12,02 |
-49,89 |
-49,95 |
0,68 |
|
Lord 10 |
14,69 |
-21,31 |
2,29 |
0,88 |
-39,96 |
-0,19 |
45,68 |
-13,99 |
-3,17 |
-8,18 |
5,58 |
27,86 |
|
Lord 11 |
18,50 |
18,87 |
51,53 |
36,24 |
26,83 |
-0,49 |
-23,61 |
47,13 |
-40,16 |
-48,24 |
-40,67 |
15,89 |
|
Lord 12 |
37,02 |
14,92 |
6,62 |
30,58 |
50,29 |
-50,26 |
4,36 |
-25,22 |
17,24 |
-0,37 |
-4,81 |
-9,87 |
Below you see the tiny effect sizes.
|
Traditional House Rulership |
|||||||||||||
|
|
H1 |
H2 |
H3 |
H4 |
H5 |
H6 |
H7 |
H8 |
H9 |
H10 |
H11 |
H12 |
Total |
|
Lord 1 |
0,98 |
0,97 |
0,96 |
1,05 |
0,98 |
0,79 |
1,06 |
1,02 |
0,98 |
0,90 |
1,12 |
1,14 |
11,97 |
|
Lord 2 |
1,00 |
1,01 |
0,92 |
0,91 |
0,93 |
1,00 |
0,95 |
1,01 |
1,05 |
1,05 |
1,23 |
0,92 |
11,97 |
|
Lord 3 |
1,00 |
1,01 |
0,98 |
1,02 |
0,78 |
0,92 |
1,02 |
0,94 |
1,19 |
0,98 |
1,05 |
1,06 |
11,95 |
|
Lord 4 |
1,05 |
0,99 |
0,98 |
0,80 |
0,82 |
0,98 |
0,92 |
1,00 |
1,07 |
1,08 |
1,07 |
1,18 |
11,94 |
|
Lord 5 |
1,10 |
1,08 |
0,87 |
0,97 |
0,95 |
0,95 |
0,84 |
0,97 |
1,05 |
0,98 |
1,15 |
1,04 |
11,95 |
|
Lord 6 |
0,95 |
1,14 |
1,03 |
0,99 |
0,88 |
0,92 |
0,84 |
1,10 |
1,03 |
1,08 |
1,09 |
0,95 |
11,98 |
|
Lord 7 |
1,03 |
1,02 |
1,05 |
0,95 |
0,82 |
0,95 |
0,99 |
1,03 |
1,09 |
1,03 |
1,04 |
1,00 |
12,00 |
|
Lord 8 |
1,01 |
0,94 |
0,94 |
1,04 |
0,86 |
1,00 |
1,02 |
1,00 |
1,07 |
1,05 |
1,00 |
1,09 |
12,01 |
|
Lord 9 |
0,88 |
0,99 |
1,15 |
1,05 |
0,79 |
1,02 |
0,94 |
1,02 |
1,01 |
1,02 |
0,91 |
1,20 |
11,99 |
|
Lord 10 |
0,99 |
0,92 |
1,08 |
1,16 |
0,91 |
0,91 |
0,93 |
0,92 |
1,09 |
1,00 |
1,16 |
0,92 |
11,99 |
|
Lord 11 |
1,08 |
0,88 |
1,01 |
0,95 |
0,91 |
0,97 |
0,90 |
0,92 |
1,20 |
1,13 |
0,99 |
1,05 |
11,99 |
|
Lord 12 |
1,10 |
0,94 |
1,03 |
1,03 |
1,01 |
0,93 |
1,11 |
0,93 |
1,01 |
0,87 |
1,07 |
0,98 |
12,00 |
|
Total |
12,16 |
11,88 |
12,02 |
11,92 |
10,65 |
11,33 |
11,52 |
11,85 |
12,84 |
12,16 |
12,88 |
12,53 |
143,74 |
|
Modern House Rulership |
|||||||||||||
|
|
H1 |
H2 |
H3 |
H4 |
H5 |
H6 |
H7 |
H8 |
H9 |
H10 |
H11 |
H12 |
Total |
|
Lord 1 |
1,00 |
0,82 |
1,01 |
1,07 |
1,06 |
0,84 |
1,11 |
0,97 |
1,04 |
1,11 |
0,91 |
1,01 |
11,95 |
|
Lord 2 |
0,85 |
0,88 |
0,85 |
0,92 |
0,92 |
1,03 |
1,11 |
1,00 |
1,11 |
1,06 |
1,16 |
0,97 |
11,85 |
|
Lord 3 |
0,93 |
0,74 |
0,75 |
0,85 |
0,97 |
0,96 |
1,13 |
0,99 |
1,30 |
1,12 |
1,06 |
0,99 |
11,79 |
|
Lord 4 |
0,98 |
0,91 |
0,78 |
0,73 |
0,89 |
0,92 |
1,02 |
1,18 |
1,09 |
1,30 |
0,93 |
1,07 |
11,81 |
|
Lord 5 |
0,93 |
1,03 |
1,05 |
0,81 |
0,82 |
0,78 |
0,96 |
0,99 |
1,20 |
1,15 |
1,06 |
1,07 |
11,85 |
|
Lord 6 |
1,01 |
1,07 |
0,92 |
0,88 |
0,70 |
0,74 |
0,94 |
1,00 |
1,25 |
1,18 |
1,06 |
1,04 |
11,79 |
|
Lord 7 |
1,06 |
1,05 |
1,03 |
0,91 |
0,88 |
0,67 |
0,98 |
1,04 |
1,17 |
1,00 |
1,19 |
0,92 |
11,89 |
|
Lord 8 |
0,97 |
1,06 |
1,13 |
0,96 |
0,96 |
0,92 |
0,88 |
0,82 |
1,05 |
1,04 |
1,15 |
0,95 |
11,90 |
|
Lord 9 |
0,94 |
1,06 |
1,20 |
1,10 |
0,78 |
0,99 |
1,00 |
0,76 |
0,90 |
1,00 |
1,00 |
1,19 |
11,91 |
|
Lord 10 |
1,08 |
0,94 |
1,16 |
1,19 |
0,98 |
0,78 |
1,01 |
0,91 |
0,84 |
0,88 |
1,12 |
1,05 |
11,94 |
|
Lord 11 |
1,07 |
1,07 |
1,00 |
1,03 |
1,05 |
0,80 |
0,95 |
1,01 |
0,98 |
0,99 |
0,98 |
1,08 |
12,00 |
|
Lord 12 |
1,03 |
1,09 |
1,12 |
1,04 |
1,00 |
1,00 |
1,13 |
0,95 |
1,07 |
0,79 |
0,87 |
0,89 |
11,99 |
|
Total |
11,86 |
11,72 |
12,00 |
11,48 |
11,02 |
10,43 |
12,21 |
11,62 |
13,00 |
12,61 |
12,48 |
12,22 |
142,66 |
You may notice that the largest effects are found in the ninth house, the lowest in the sixth house. Clear patters are not found.
Spreadsheets used are in the directory astrologer of adbstats :
(973, 1073) = 0
(1073, 1173) = 0
(1173, 1273) = 0
(1273, 1373) = 0
(1373, 1473) = 5
(1473, 1573) = 12
(1573, 1673) = 16
(1673, 1773) = 1
(1773, 1873) = 86
(1873, 1973) = 1729
(1973, 2073) = 11
Total = 1867
The used control group was control-group
In 2021 Adb_version_210209_1352 and TkAstroDb version 2.4.2 came out. The results of 1943 astrologers under different house systems can be studied here: astrologer.